
Ubiquitous Pragmatic Trial Impact Analysis: How to Prevent a Year of Death and Suffering for 84 Cents
Only 15 diseases/year (95% CI: 8 diseases/year-30 diseases/year) get their first treatment each year. With 6.65 thousand diseases (95% CI: 5.7 thousand diseases-8.24 thousand diseases) lacking effective treatments, the backlog would take 443 years (95% CI: 324 years-712 years) to clear. Integrating pragmatic trials into standard healthcare increases trial capacity 12.3x (95% CI: 4.2x-61.4x), cutting that timeline from 443 years (95% CI: 324 years-712 years) to 36 years (95% CI: 11.6 years-77.1 years). The average untreated disease gets a treatment 212 years (95% CI: 135 years-355 years) earlier, saving 10.7 billion deaths (95% CI: 7.4 billion deaths-16.2 billion deaths) at $0.842 (95% CI: $0.242-$1.75) per year of healthy life saved.
Abstract
Of 9.5 million combinations plausible drug-disease pairings, only 0.342% (95% CI: 0%-1%) have been clinically tested. At the current discovery rate of 15 diseases/year (95% CI: 8 diseases/year-30 diseases/year), clearing this backlog would take ~443 years (95% CI: 324 years-712 years). A decentralized FDA integrating pragmatic clinical trials into standard healthcare at $929 (95% CI: $97-$3K)/patient (vs. $41K (95% CI: $20K-$120K) traditional) increases trial capacity 12.3x (95% CI: 4.2x-61.4x), reducing backlog clearance to 36 years (95% CI: 11.6 years-77.1 years). Combined with eliminating the 8.2 years (95% CI: 4.85 years-11.5 years) post-safety efficacy delay through opt-in trial participation after Phase I, treatments arrive 212 years (95% CI: 135 years-355 years) earlier on average. This timeline shift saves 10.7 billion deaths (95% CI: 7.4 billion deaths-16.2 billion deaths), averts 565 billion DALYs (95% CI: 361 billion DALYs-877 billion DALYs), and eliminates 1.93 quadrillion hours (95% CI: 1.36 quadrillion hours-2.62 quadrillion hours) of suffering (YLD portion of 565 billion DALYs (95% CI: 361 billion DALYs-877 billion DALYs) converted to hours) at $0.842 (95% CI: $0.242-$1.75)/DALY, competitive with bed nets ($89 (95% CI: $78-$100)/DALY) at vastly greater scale. Using standard health economic valuation ($150K (95% CI: $100K-$199K)/DALY, the US cost-effectiveness threshold; conservative relative to EPA/DOT Value of Statistical Life estimates), full impact yields $84.8 quadrillion (95% CI: $62.4 quadrillion-$97.3 quadrillion) in cumulative value (565 billion DALYs (95% CI: 361 billion DALYs-877 billion DALYs) cumulative DALYs over the 212 years (95% CI: 135 years-355 years) timeline shift, not annual; 178k (95% CI: 110k-421k):1 ROI).
Keywords
dfda, cost-benefit-analysis, roi, return-on-investment, clinical-trials, drug-development, health-economics, pragmatic-trials, recovery-trial, real-world-evidence, regulatory-efficiency, decentralized-fda
1 Executive Summary
The Problem: 6.65 thousand diseases (95% CI: 5.7 thousand diseases-8.24 thousand diseases) have zero FDA-approved treatments. We have 9.5 thousand compounds (95% CI: 7 thousand compounds-12 thousand compounds) proven-safe compounds (FDA-approved drugs + GRAS substances), yet only 0.342% (95% CI: 0%-1%) of 9.5 million combinations plausible drug-disease combinations have been tested. At the current discovery rate of 15 diseases/year (95% CI: 8 diseases/year-30 diseases/year), clearing this backlog would take ~443 years (95% CI: 324 years-712 years). Of 2.4 billion people (95% CI: 2 billion people-2.8 billion people) with chronic disease, only 1.9 million patients/year (95% CI: 1.5 million patients/year-2.3 million patients/year) participate in trials annually (0.06%).
The Solution: A decentralized FDA139,140, an open protocol (like HTTP/FHIR, not a competing platform) that existing DCT platforms, EHRs, and health apps adopt to integrate pragmatic clinical trials into standard healthcare, enabling:
- Subsidized Patient Participation: Patients receive subsidies to participate in trials, making participation accessible and incentivized
- Universal Trial Access: Any patient can join trials from home via their phone or computer - no travel to research centers required
- Real-World Data Aggregation: Outcomes from all participants are aggregated into a unified database
- Treatment Rankings: Standardized effectiveness rankings for every treatment-condition pair, updated continuously with real-world evidence
- Outcome Labels: “Nutrition facts for drugs” showing exactly what happened to real patients who tried each treatment
1.1 The Receipts
| Metric | Value | Context |
|---|---|---|
| Cost-Effectiveness | $0.842 (95% CI: $0.242-$1.75)/DALY | Competitive with bed nets ($89 (95% CI: $78-$100)/DALY) at vastly greater scale |
| Lives Saved | 10.7 billion deaths (95% CI: 7.4 billion deaths-16.2 billion deaths) |
One-time benefit from 212 years (95% CI: 135 years-355 years) timeline shift |
| DALYs Averted | 565 billion DALYs (95% CI: 361 billion DALYs-877 billion DALYs) |
Captures both mortality and morbidity |
| Suffering Eliminated | 1.93 quadrillion hours (95% CI: 1.36 quadrillion hours-2.62 quadrillion hours) |
YLD portion of DALYs (39%) x 8,760 hrs/yr over timeline shift |
| Total Economic Value | $84.8 quadrillion (95% CI: $62.4 quadrillion-$97.3 quadrillion) |
Cumulative DALYs x $150K/DALY (WHO threshold) over 212 years (95% CI: 135 years-355 years) shift |
| Efficacy Lag Eliminated | Post-Phase I access via trial participation | |
| ROI (R&D Savings) | 637 (95% CI: 569-790):1 | 44.1x (95% CI: 39.4x-89.1x) cheaper trials |
| Annual R&D Savings | From 97.7% (95% CI: 97%-99%) cost reduction | |
| Trial Capacity Increase | Enabling parallel therapeutic space exploration |
1.2 Why These Numbers Are Large
The economic value figure ($84.8 quadrillion (95% CI: $62.4 quadrillion-$97.3 quadrillion)) exceeds global GDP ($115T). This is expected, not an error. Three points of context:
1. Standard methodology, applied at scale. The $150K (95% CI: $100K-$199K)/DALY valuation is the US cost-effectiveness threshold (ICER). It is conservative relative to EPA and DOT Value of Statistical Life estimates, which imply higher per-DALY values when converted (~$300K-$600K/DALY). We did not invent this number. We multiplied it by the number of sick people.
2. GDP measures transactions, not the value of being alive. GDP does not count the value of not being dead, not being in pain, or not watching your children die of treatable diseases. Health economists have measured these values for decades. The global burden of disease (2.88 billion DALYs/year (95% CI: 2.63 billion DALYs/year-3.13 billion DALYs/year)/year) valued at $150K (95% CI: $100K-$199K)/DALY produces $400T (95% CI: $240T-$587T)/year in health losses, roughly 3.5x global GDP. This is consistent with the established finding that the value of health substantially exceeds market output141,142.
3. The figure is cumulative over 212 years (95% CI: 135 years-355 years), not annual. This is the total value of permanently accelerating medical progress, the same methodology used to value smallpox eradication ($300M program -> millions of future lives saved) and climate infrastructure (multi-trillion dollar damage estimates that exceed annual GDP). The only debatable input is whether the timeline shift is really ~212 (95% CI: 135-355) years; see The Discovery Capacity Model for that derivation.
1.3 Key Metric Derivations
Lives Saved:
\[
\begin{gathered}
Lives_{max} \\
= Deaths_{disease,daily} \times T_{accel,max} \times 338 \\
= 150{,}000 \times 212 \times 338 \\
= 10.7B
\end{gathered}
\]
where:
\[
T_{accel,max} = T_{accel} + T_{lag} = 204 + 8.2 = 212
\]
where:
\[
\begin{gathered}
T_{accel} \\
= T_{first,SQ} \times \left(1 - \frac{1}{k_{capacity}}\right) \\
= 222 \times \left(1 - \frac{1}{12.3}\right) \\
= 204
\end{gathered}
\]
where:
\[
\begin{gathered}
T_{first,SQ} \\
= T_{queue,SQ} \times 0.5 \\
= 443 \times 0.5 \\
= 222
\end{gathered}
\]
where:
\[
\begin{gathered}
T_{queue,SQ} \\
= \frac{N_{untreated}}{Treatments_{new,ann}} \\
= \frac{6{,}650}{15} \\
= 443
\end{gathered}
\]
where:
\[
\begin{gathered}
N_{untreated} \\
= N_{rare} \times 0.95 \\
= 7{,}000 \times 0.95 \\
= 6{,}650
\end{gathered}
\]
where:
\[
\begin{gathered}
k_{capacity} \\
= \frac{N_{fundable,dFDA}}{Slots_{curr}} \\
= \frac{23.4M}{1.9M} \\
= 12.3
\end{gathered}
\]
where:
\[
\begin{gathered}
N_{fundable,dFDA} \\
= \frac{Subsidies_{dFDA,ann}}{Cost_{pragmatic,pt}} \\
= \frac{\$21.8B}{\$929} \\
= 23.4M
\end{gathered}
\]
where:
\[
\begin{gathered}
Subsidies_{dFDA,ann} \\
= Funding_{dFDA,ann} - OPEX_{dFDA} \\
= \$21.8B - \$40M \\
= \$21.8B
\end{gathered}
\]
where:
\[
\begin{gathered}
OPEX_{dFDA} \\
= Cost_{platform} + Cost_{staff} + Cost_{infra} \\
+ Cost_{regulatory} + Cost_{community} \\
= \$15M + \$10M + \$8M + \$5M + \$2M \\
= \$40M
\end{gathered}
\]
Suffering Hours Eliminated:
\[
\begin{gathered}
Hours_{suffer,max} \\
= DALYs_{max} \times Pct_{YLD} \times 8760 \\
= 565B \times 0.39 \times 8760 \\
= 1930T
\end{gathered}
\]
where:
\[
\begin{gathered}
DALYs_{max} \\
= DALYs_{global,ann} \times Pct_{avoid,DALY} \times T_{accel,max} \\
= 2.88B \times 92.6\% \times 212 \\
= 565B
\end{gathered}
\]
where:
\[
T_{accel,max} = T_{accel} + T_{lag} = 204 + 8.2 = 212
\]
where:
\[
\begin{gathered}
T_{accel} \\
= T_{first,SQ} \times \left(1 - \frac{1}{k_{capacity}}\right) \\
= 222 \times \left(1 - \frac{1}{12.3}\right) \\
= 204
\end{gathered}
\]
where:
\[
\begin{gathered}
T_{first,SQ} \\
= T_{queue,SQ} \times 0.5 \\
= 443 \times 0.5 \\
= 222
\end{gathered}
\]
where:
\[
\begin{gathered}
T_{queue,SQ} \\
= \frac{N_{untreated}}{Treatments_{new,ann}} \\
= \frac{6{,}650}{15} \\
= 443
\end{gathered}
\]
where:
\[
\begin{gathered}
N_{untreated} \\
= N_{rare} \times 0.95 \\
= 7{,}000 \times 0.95 \\
= 6{,}650
\end{gathered}
\]
where:
\[
\begin{gathered}
k_{capacity} \\
= \frac{N_{fundable,dFDA}}{Slots_{curr}} \\
= \frac{23.4M}{1.9M} \\
= 12.3
\end{gathered}
\]
where:
\[
\begin{gathered}
N_{fundable,dFDA} \\
= \frac{Subsidies_{dFDA,ann}}{Cost_{pragmatic,pt}} \\
= \frac{\$21.8B}{\$929} \\
= 23.4M
\end{gathered}
\]
where:
\[
\begin{gathered}
Subsidies_{dFDA,ann} \\
= Funding_{dFDA,ann} - OPEX_{dFDA} \\
= \$21.8B - \$40M \\
= \$21.8B
\end{gathered}
\]
where:
\[
\begin{gathered}
OPEX_{dFDA} \\
= Cost_{platform} + Cost_{staff} + Cost_{infra} \\
+ Cost_{regulatory} + Cost_{community} \\
= \$15M + \$10M + \$8M + \$5M + \$2M \\
= \$40M
\end{gathered}
\]
Cost per DALY:
\[
\begin{gathered}
Cost_{direct,DALY} \\
= \frac{NPV_{direct}}{DALYs_{max}} \\
= \frac{\$476B}{565B} \\
= \$0.842
\end{gathered}
\]
where:
\[
NPV_{direct} = Funding_{ann} \times \frac{1 - (1+r)^{-T}}{r}
\]
where:
\[
\begin{gathered}
T_{queue,dFDA} \\
= \frac{T_{queue,SQ}}{k_{capacity}} \\
= \frac{443}{12.3} \\
= 36
\end{gathered}
\]
where:
\[
\begin{gathered}
T_{queue,SQ} \\
= \frac{N_{untreated}}{Treatments_{new,ann}} \\
= \frac{6{,}650}{15} \\
= 443
\end{gathered}
\]
where:
\[
\begin{gathered}
N_{untreated} \\
= N_{rare} \times 0.95 \\
= 7{,}000 \times 0.95 \\
= 6{,}650
\end{gathered}
\]
where:
\[
\begin{gathered}
k_{capacity} \\
= \frac{N_{fundable,dFDA}}{Slots_{curr}} \\
= \frac{23.4M}{1.9M} \\
= 12.3
\end{gathered}
\]
where:
\[
\begin{gathered}
N_{fundable,dFDA} \\
= \frac{Subsidies_{dFDA,ann}}{Cost_{pragmatic,pt}} \\
= \frac{\$21.8B}{\$929} \\
= 23.4M
\end{gathered}
\]
where:
\[
\begin{gathered}
Subsidies_{dFDA,ann} \\
= Funding_{dFDA,ann} - OPEX_{dFDA} \\
= \$21.8B - \$40M \\
= \$21.8B
\end{gathered}
\]
where:
\[
\begin{gathered}
OPEX_{dFDA} \\
= Cost_{platform} + Cost_{staff} + Cost_{infra} \\
+ Cost_{regulatory} + Cost_{community} \\
= \$15M + \$10M + \$8M + \$5M + \$2M \\
= \$40M
\end{gathered}
\]
where:
\[
\begin{gathered}
DALYs_{max} \\
= DALYs_{global,ann} \times Pct_{avoid,DALY} \times T_{accel,max} \\
= 2.88B \times 92.6\% \times 212 \\
= 565B
\end{gathered}
\]
where:
\[
T_{accel,max} = T_{accel} + T_{lag} = 204 + 8.2 = 212
\]
where:
\[
\begin{gathered}
T_{accel} \\
= T_{first,SQ} \times \left(1 - \frac{1}{k_{capacity}}\right) \\
= 222 \times \left(1 - \frac{1}{12.3}\right) \\
= 204
\end{gathered}
\]
where:
\[
\begin{gathered}
T_{first,SQ} \\
= T_{queue,SQ} \times 0.5 \\
= 443 \times 0.5 \\
= 222
\end{gathered}
\]
1.4 Interpreting These Figures: Cumulative, Not Annual
These are cumulative benefits over the entire acceleration period, not annual figures. This is the same methodology used to value smallpox eradication (program cost -> total future lives saved) and climate infrastructure investments: the one-time benefit of permanently accelerating medical progress.
Interpreting the Timeline Figure: The 212 years (95% CI: 135 years-355 years) figure represents a discovery capacity model of medical research. Think of the therapeutic search space as the set of all untested drug-disease combinations, with trial capacity determining how fast we can explore it.
1.5 The Discovery Capacity Model
| Parameter | Status Quo | Proposed | Impact |
|---|---|---|---|
| Untreated diseases | 6.65 thousand diseases (95% CI: 5.7 thousand diseases-8.24 thousand diseases) |
6.65 thousand diseases (95% CI: 5.7 thousand diseases-8.24 thousand diseases) |
Same backlog |
| Discovery rate (first treatments/year) | 185 diseases/year (95% CI: 107 diseases/year-491 diseases/year) |
12.3x (95% CI: 4.2x-61.4x) faster | |
| Time to explore search space | Centuries saved | ||
| Expected time to first treatment | ~443 years (95% CI: 324 years-712 years)/2 | ~36 years (95% CI: 11.6 years-77.1 years)/2 | 204 years (95% CI: 123 years-350 years) earlier |
Why treatments arriving sooner saves lives:
A disease that would receive its first effective treatment in year 200 under the status quo might receive it in year 16 with the framework. During those 184 years, people die from that disease who could have been saved. The 10.7 billion deaths (95% CI: 7.4 billion deaths-16.2 billion deaths) figure captures the cumulative lives saved across all diseases during their acceleration periods.
The two components:
- Discovery acceleration (204 years (95% CI: 123 years-350 years)): Higher discovery rate explores the therapeutic space faster, moving treatments forward
- Efficacy lag elimination (8.2 years (95% CI: 4.85 years-11.5 years)): Once discovered, treatments reach patients immediately instead of waiting for Phase II/III
Total timeline shift: 212 years (95% CI: 135 years-355 years) = 204 years (95% CI: 123 years-350 years) + 8.2 years (95% CI: 4.85 years-11.5 years)
How the 12.3x (95% CI: 4.2x-61.4x) capacity increase works: With $21.8B/year in trial funding at $929 (95% CI: $97-$3K)/patient (based on ADAPTABLE trial), the framework enables 23.4 million patients/year (95% CI: 9.46 million patients/year-97 million patients/year) annual trial participants vs. current 1.9 million patients/year (95% CI: 1.5 million patients/year-2.3 million patients/year), increasing trial completion rate from 15 diseases/year (95% CI: 8 diseases/year-30 diseases/year) to 185 diseases/year (95% CI: 107 diseases/year-491 diseases/year). This removes the primary bottleneck to medical progress: currently less than 0.06% of willing patients can access trials, and over 9.5 thousand compounds (95% CI: 7 thousand compounds-12 thousand compounds) proven-safe (FDA-approved drugs + GRAS substances) remain untested for most conditions they could improve.
2 Capabilities
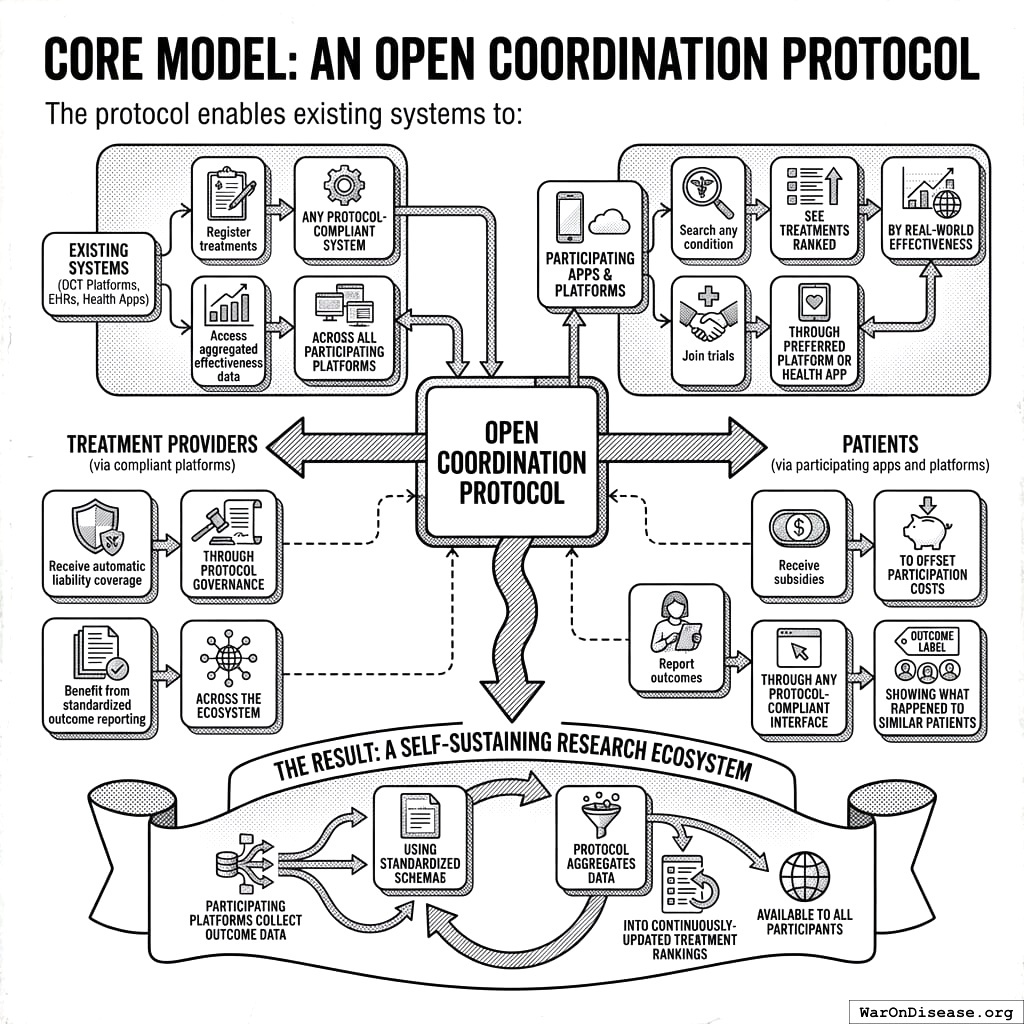
2.1 Core Model: An Open Coordination Protocol
The protocol enables existing systems (DCT platforms, EHRs, health apps) to:
For Treatment Providers (via compliant platforms):
- Register treatments through any protocol-compliant system
- Access aggregated effectiveness data across all participating platforms
- Receive automatic liability coverage through protocol governance
- Benefit from standardized outcome reporting across the ecosystem
For Patients (via participating apps and platforms):
- Search any condition, see treatments ranked by real-world effectiveness
- Join trials through their preferred platform or health app
- Receive subsidies to offset participation costs
- Report outcomes through any protocol-compliant interface
- Access “Outcome Labels” showing what happened to similar patients
The Result: A self-sustaining research ecosystem where participating platforms collect outcome data using standardized schemas, and the protocol aggregates this into continuously-updated treatment rankings available to all participants.
2.2 Key Capabilities
- Treatment Rankings: Every treatment for every condition ranked by real-world effectiveness, updated continuously as new data arrives
- Outcome Labels: Standardized “nutrition facts for drugs” showing effectiveness rates, side effects, and outcomes from real patients
- Universal Trial Access: Any patient can participate from anywhere via phone/computer
- Real-Time Surveillance: Continuous data on efficacy, side effects, and drug interactions
- Federated Data Architecture: Data stays in source systems (EHR platforms, consumer health apps) while queries run across all sources
2.3 Potential Impact on the Status Quo
- Speed of Trials: Reduced overhead and automated data capture compresses timelines.
- Cost of Trials: Using existing healthcare encounters, telemedicine, and EHR data to drastically cut per-patient costs (modeled on pragmatic trials like Oxford RECOVERY and the US-based ADAPTABLE trial).
- Scale & Scope: Enables testing many more drugs, off-label indications, unpatentable treatments, nutraceuticals, and personalized medicine approaches.
- Innovation Incentives: Lower R&D costs increase profitability and encourage more entrants/innovation in the life sciences.
3 Addressing Key Concerns
3.1 Historical Validation: Pre-1962 Physician-Led Efficacy Testing
The decentralized physician-led efficacy model is not theoretical. It operated successfully from 1883 to 1960, providing 77 years of empirical validation.
How the pre-1962 system worked:
From 1883 to 1960, 144 thousand physicians across America tested drug efficacy on real patients in routine clinical practice. The Journal of the American Medical Association (JAMA) compiled observational reports, leading medical experts peer-reviewed the aggregated data, and effective treatments received endorsement. This decentralized approach successfully identified antibiotics, vaccines, and countless surgical techniques.
Cost comparison demonstrates dramatic efficiency:
| Era | Cost per Drug (2024 USD) | System |
|---|---|---|
| Pre-1962 | Decentralized physician-led efficacy testing | |
| Post-1962 | Centralized pharmaceutical company trials | |
| Cost Increase | Regulatory mandate, not drug complexity |
The cost explosion began exactly when efficacy testing was centralized within pharmaceutical companies. This wasn’t a natural evolution of drug development or increasing drug complexity. The same types of compounds (small molecules, biologics) that cost $24.7M (95% CI: $19.5M-$30M) to develop in 1960 now cost $2.6B (95% CI: $1.5B-$4B).
The thalidomide success story: Thalidomide is often cited as justification for the 1962 amendments, but the US already blocked thalidomide under existing 1938 safety regulations. The FDA’s Frances Kelsey refused approval based on inadequate safety data, not efficacy requirements. The 1962 amendments added efficacy proof requirements, not additional safety testing.
Implications: This model returns to decentralized physician-led efficacy testing but with modern automation (electronic health records, AI-assisted analysis, real-time data aggregation), targeting the same 50-95% cost reductions that the pre-1962 system achieved.
3.2 Why “Eventually Avoidable” Matters
A critical assumption in this analysis is that 92.6% (95% CI: 50%-98%) of disease deaths are “eventually avoidable” - meaning they could be prevented with sufficient biomedical research over time.
Why this assumption is conservative:
Historical trend: In 1900, life expectancy was ~47 years. Today it’s ~79. Most of that gain came from preventing deaths that were once considered inevitable (infectious disease, childhood mortality, cardiovascular disease).
Known mechanisms exist: For most major disease categories, we understand enough biology to know that interventions are theoretically possible. Cancer is caused by specific mutations. Heart disease has identifiable risk factors. The question is finding the right treatments, not whether treatments can exist.
Already-discovered treatments prove the space: 30% of approved drugs gain new indications, demonstrating that effective treatments exist but haven’t been found yet.
What if this assumption is wrong?
Even if only 25% of deaths are eventually avoidable (half our estimate), the framework still generates 637 (95% CI: 569-790):1 ROI from R&D savings alone, independent of health benefits. These deaths will eventually be preventable with sufficient research progress. The health impact figures scale linearly with avoidability assumptions, but the cost-saving case doesn’t depend on them.
3.3 Trial Funding Scenario
This analysis models a scenario with $21.8B/year allocated to pragmatic clinical trials. At $929 (95% CI: $97-$3K)/patient, this funds approximately 23.4 million patients/year (95% CI: 9.46 million patients/year-97 million patients/year) patient-years annually.
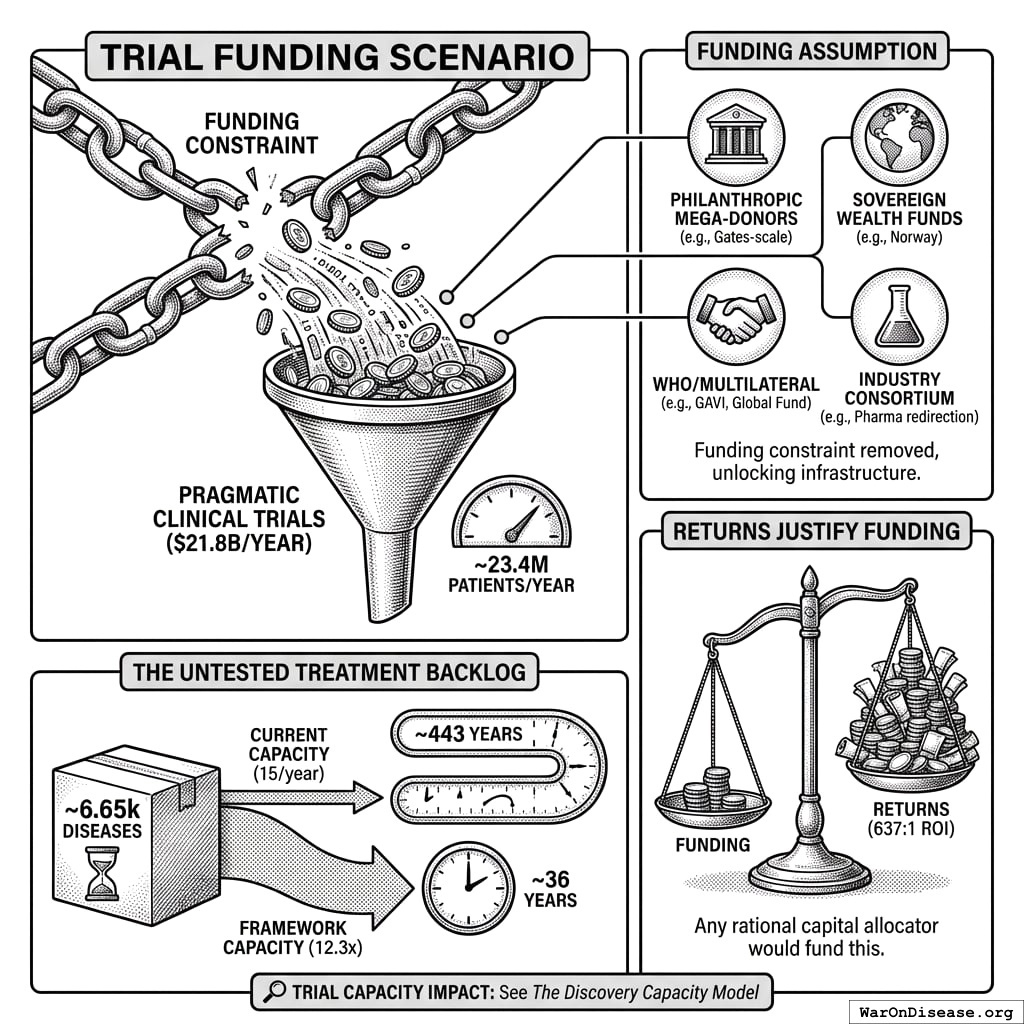
3.4 On the Funding Assumption
This analysis demonstrates what becomes possible when the funding constraint is removed. The $21.8B/year figure is achievable through multiple mechanisms:
- Philanthropic mega-donors: A single Gates Foundation-scale commitment could fund the protocol infrastructure and initial years
- Sovereign wealth funds: Norway’s $1.4T fund or similar could view this as humanity-scale infrastructure
- WHO/multilateral coordination: Comparable to GAVI or the Global Fund
- Military reallocation: Less than 1% of global military spending ($2.72T/year)
- Industry consortium: Pharma collectively spends $60B (95% CI: $50B-$75B)/year on trials; even 10% redirection exceeds this threshold
The returns justify the funding, not vice versa. At 637 (95% CI: 569-790):1 ROI, any rational capital allocator would fund this if they believed the analysis.
Trial Capacity Impact: See The Discovery Capacity Model for the full comparison of status quo vs. framework trial capacity metrics.
The Untested Treatment Backlog:
Approximately 6.65 thousand diseases (95% CI: 5.7 thousand diseases-8.24 thousand diseases) have zero FDA-approved treatments. At current trial capacity (15 diseases/year (95% CI: 8 diseases/year-30 diseases/year)), systematically testing all 9.5 million combinations plausible pairings would take ~443 years (95% CI: 324 years-712 years). With 12.3x (95% CI: 4.2x-61.4x) capacity, this drops to ~36 years (95% CI: 11.6 years-77.1 years).
4 Framework Costs (ROM Estimates)
Protocol Infrastructure Costs
This is protocol infrastructure, open standards and APIs that existing clinical trial systems adopt. This is analogous to HTTP enabling any browser to access any website, or FHIR enabling health data interoperability.
- Upfront protocol/API build: $15–25M
- Annual protocol operations: $5–12M
- Integration onboarding fund: $20-50M (one-time, to support EHR and DCT platform adoption)
- Total initiative: ~$40-75M upfront, $5-12M annual
Ecosystem Integration: The protocol leverages existing infrastructure - DCT platforms, major EHR systems, academic medical centers, and consumer health apps. These organizations have invested billions in infrastructure that becomes more valuable through protocol interoperability.
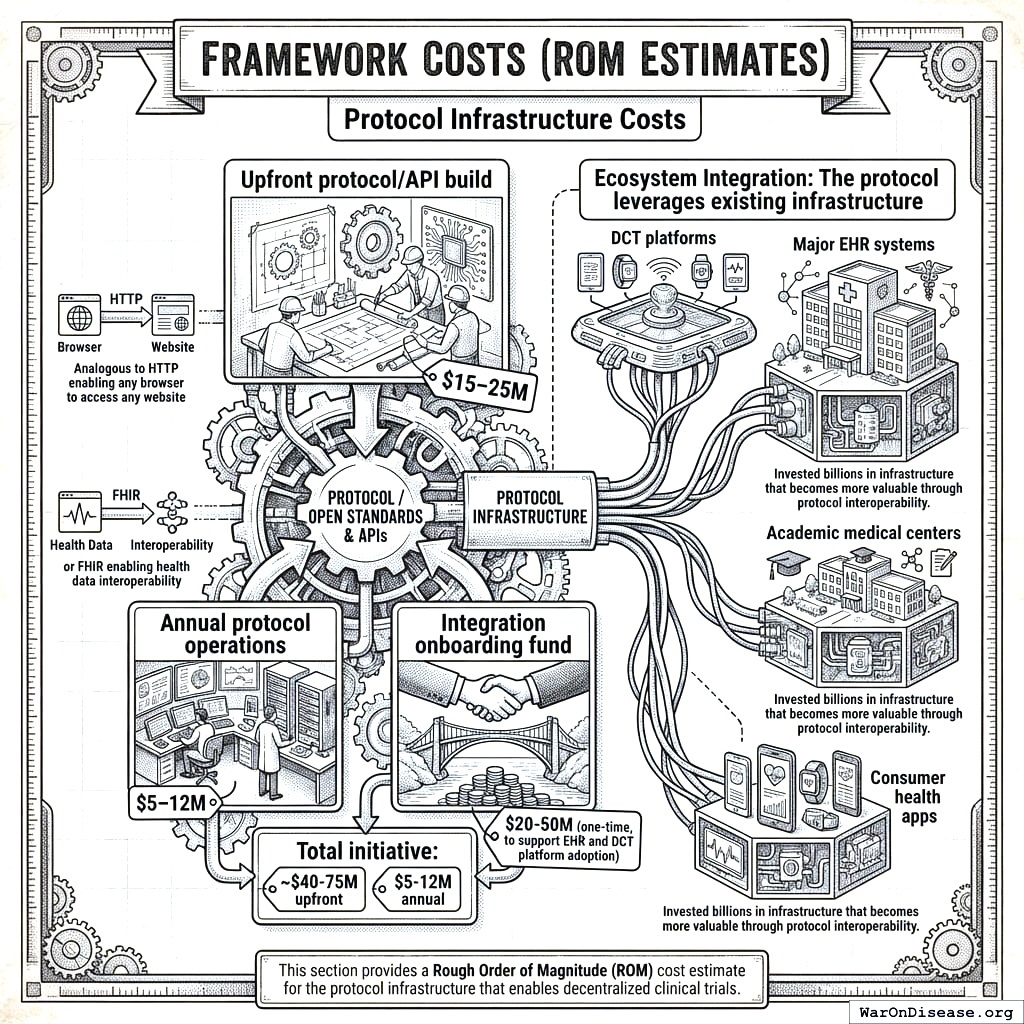
This section provides a Rough Order of Magnitude (ROM) cost estimate for the protocol infrastructure that enables decentralized clinical trials.
4.1 Upfront Build Costs (30 Months)
Core Engineering & Development Effort:
- Basis: ~75 FTEs 2.5 years $200k/FTE/year
- Activities: Detailed design, Core framework development (API, storage, mapping/validation, auth), reference frontend, initial plugin interfaces, testing, documentation, initial deployment.
The engineering cost is calculated as:
\[ C_{\text{engineering}} = N_{\text{FTEs}} \times T \times C_{\text{FTE}} = 75 \times 2.5 \times \$200\text{k} = \$37.5\text{M} \]
Where \(N_{\text{FTEs}} = 75\) is the number of full-time equivalents, \(T = 2.5\) years is the development timeline, and \(C_{\text{FTE}} = \$200\text{k}\) per FTE per year.
- Estimated ROM: $35 - $40M
Infrastructure Setup & Initial Cloud Costs:
- Activities: Establishing cloud accounts, VPCs, Kubernetes cluster (EKS) setup, database provisioning (RDS/TimescaleDB), S3 buckets, CI/CD pipeline setup, initial IaC development (Terraform).
- Costs: Includes initial compute/storage during development/testing, potential small upfront reservations.
- Estimated ROM: $1 - $3 Million
Software Licenses & Tooling (Initial):
- Examples: Potential costs for monitoring tools (Datadog), security scanners (Snyk), specialized libraries, collaboration tools if not already covered.
- Estimated ROM: $0.5 - $1 Million
Compliance, Legal & Security (Initial Setup):
- Activities: Initial HIPAA/GDPR compliance assessment, policy development, security architecture review, legal consultation for data sharing frameworks.
- Estimated ROM: $1 - $2 Million
The total upfront cost is the sum of all components:
\[ C_0 = C_{\text{engineering}} + C_{\text{infrastructure}} + C_{\text{software}} + C_{\text{compliance}} \]
Where:
- \(C_{\text{engineering}} = \$35 - \$40\) million (Core Engineering & Development)
- \(C_{\text{infrastructure}} = \$1 - \$3\) million (Infrastructure Setup & Initial Cloud Costs)
- \(C_{\text{software}} = \$0.5 - \$1\) million (Software Licenses & Tooling)
- \(C_{\text{compliance}} = \$1 - \$2\) million (Compliance, Legal & Security)
Total Estimated Upfront Cost (ROM): $37.5 - $46M
Note: This ROM estimate focuses only on the Core framework build effort and associated setup. It represents the foundational first step. A full global implementation requires significant additional investment in broader initiatives to achieve goals of global integration, legal harmonization, and massive scale. These crucial, follow-on costs are estimated separately in the Scenario Based ROM Estimates for Broader Initiative Costs section below and include:
- Global EHR/Data Source Integration Effort: Building/buying connectors for thousands of systems worldwide.
- Large-Scale Plugin Development: Funding the ecosystem of data importers, analysis tools, and visualization plugins.
- International Legal/Regulatory Harmonization: Major diplomatic and legal efforts to create a global standard.
- Global Rollout & Adoption: Costs associated with driving adoption and providing training worldwide.
- Massive-Scale Infrastructure: Scaling hardware and cloud resources beyond initial targets to support millions of users.
The following sections provide ROM estimates for both the ongoing operational costs of the Core framework and for these essential broader initiatives.
4.2 Ecosystem Participants
The protocol creates value by enabling interoperability among existing clinical trial infrastructure. These organizations represent the ecosystem that would adopt and benefit from the protocol:
| Participant | Current Investment | How They Integrate | What They Gain |
|---|---|---|---|
| DCT Platforms | $1B+ collectively in VC funding | Adopt outcome reporting standards | Interoperability, larger patient pools, regulatory credibility |
| Major EHR Systems | Billions in infrastructure | Enable federated queries | New revenue from research queries, competitive differentiation |
| Pharma Sponsors | $60B (95% CI: $50B-$75B)/year on trials | Submit trials via compliant systems | Lower costs, faster enrollment, real-world evidence |
| Academic Medical Centers | Research infrastructure | Contribute federated data nodes | Research funding, publication opportunities |
| Consumer Health Apps | Consumer health data | Report patient outcomes to protocol | User engagement, clinical validation |
4.3 Why This Matters
DCT platforms (collectively raising over $1B in venture funding) and major EHR systems have already built the infrastructure for patient recruitment, data collection, and trial management. The protocol doesn’t replicate this work - it makes their existing investments more valuable by enabling data to flow across systems.
4.4 Annual Operational Costs (5M MAU Target Scale)
Cloud Infrastructure Costs (AWS):
- Components: EKS cluster, RDS/TimescaleDB hosting, S3 storage & requests, SQS messaging, API Gateway usage, Data Transfer (egress), CloudWatch logging/monitoring.
- Basis: Highly dependent on actual usage patterns, data retrieval frequency, processing intensity. Assumes optimized resource usage.
- Estimated ROM: $5 - $15 Million / year (Very sensitive to scale and usage patterns)
Ongoing Engineering, Maintenance & Operations:
- Team Size: Assume ~20 FTEs (SREs, DevOps, Core Maintainers, Security).
- Basis: 20 FTEs * $200k/FTE/year
The ongoing engineering cost is calculated as:
\[ C_{\text{engineering}}^{\text{ops}} = N_{\text{FTEs}}^{\text{ops}} \times C_{\text{FTE}} = 20 \times \$200\text{k} = \$4\text{M}/\text{year} \]
Where \(N_{\text{FTEs}}^{\text{ops}} = 20\) is the number of FTEs for ongoing operations.
- Estimated ROM: $4 - $6 Million / year
Software Licenses & Tooling (Ongoing):
- Examples: Monitoring (Datadog/New Relic), Error Tracking (Sentry), Security Tools, potential DB license/support costs at scale.
- Estimated ROM: $0.5 - $1.5 Million / year
Compliance & Auditing (Ongoing):
- Activities: Regular security audits (penetration tests, compliance checks), maintaining certifications, legal reviews.
- Estimated ROM: $0.5 - $1 Million / year
Support (User & Developer):
- Activities: Tier 1/2 support for protocol participants and third-party plugin developers.
- Estimated ROM: $1 - $3 Million / year (Scales with user base)
The total annual operational cost is the sum of all components:
\[ C_{\text{op}} = C_{\text{cloud}} + C_{\text{engineering}} + C_{\text{software}} + C_{\text{compliance}} + C_{\text{support}} \]
Where:
- \(C_{\text{cloud}} = \$5 - \$15\) million/year (Cloud Infrastructure Costs)
- \(C_{\text{engineering}} = \$4 - \$6\) million/year (Ongoing Engineering, Maintenance & Operations)
- \(C_{\text{software}} = \$0.5 - \$1.5\) million/year (Software Licenses & Tooling)
- \(C_{\text{compliance}} = \$0.5 - \$1\) million/year (Compliance & Auditing)
- \(C_{\text{support}} = \$1 - \$3\) million/year (Support)
Total Estimated Annual Operations (Platform Only, ROM): $11 - $26.5 Million / year
4.4.1 Marginal Cost Analysis per User
The 5M MAU target is an illustrative milestone used for these initial ROM estimates, not the ultimate goal for the framework, which is to support hundreds of millions or billions of users. At this initial scale, you can analyze the cost on a per-user basis.
- Average Cost Range Per User (at 5M MAU):
- Based on the total annual operational cost range of $11M - $26.5M, the average cost per user is: \[ \frac{\$11,000,000 \text{ to } \$26,500,000}{5{,}000{,}000 \text{ users}} = \mathbf{\$2.20 \text{ to } \$5.30 \text{ per user per year}} \]
- Marginal Cost Per Additional User:
- As federated data infrastructure, the framework has high fixed costs (protocol development, core engineering) but very low variable costs. Therefore, the marginal cost of supporting one additional participant is expected to be a small fraction of the average cost, likely pennies per year. This cost will decrease further as the protocol achieves greater economies of scale, making it exceptionally efficient at supporting a global participant base.
(Note: The underlying cloud infrastructure cost ($5M-$15M/year) is a top-down ROM estimate. A more granular, bottom-up analysis based on projected per-user storage, data transfer, and compute would provide further support for these figures and is a key area for future refinement of this model.)
Note on Participant Financial Contributions:
This cost estimate covers building the protocol infrastructure, not paying patients for trial participation. Trial participation costs would be handled separately through funding mechanisms (government grants, foundation funding, or sponsor payments). The protocol coordinates information exchange but doesn’t move money around directly.
This estimate excludes costs for governance structure and plugin development.
4.5 Scenario Based ROM Estimates for Broader Initiative Costs
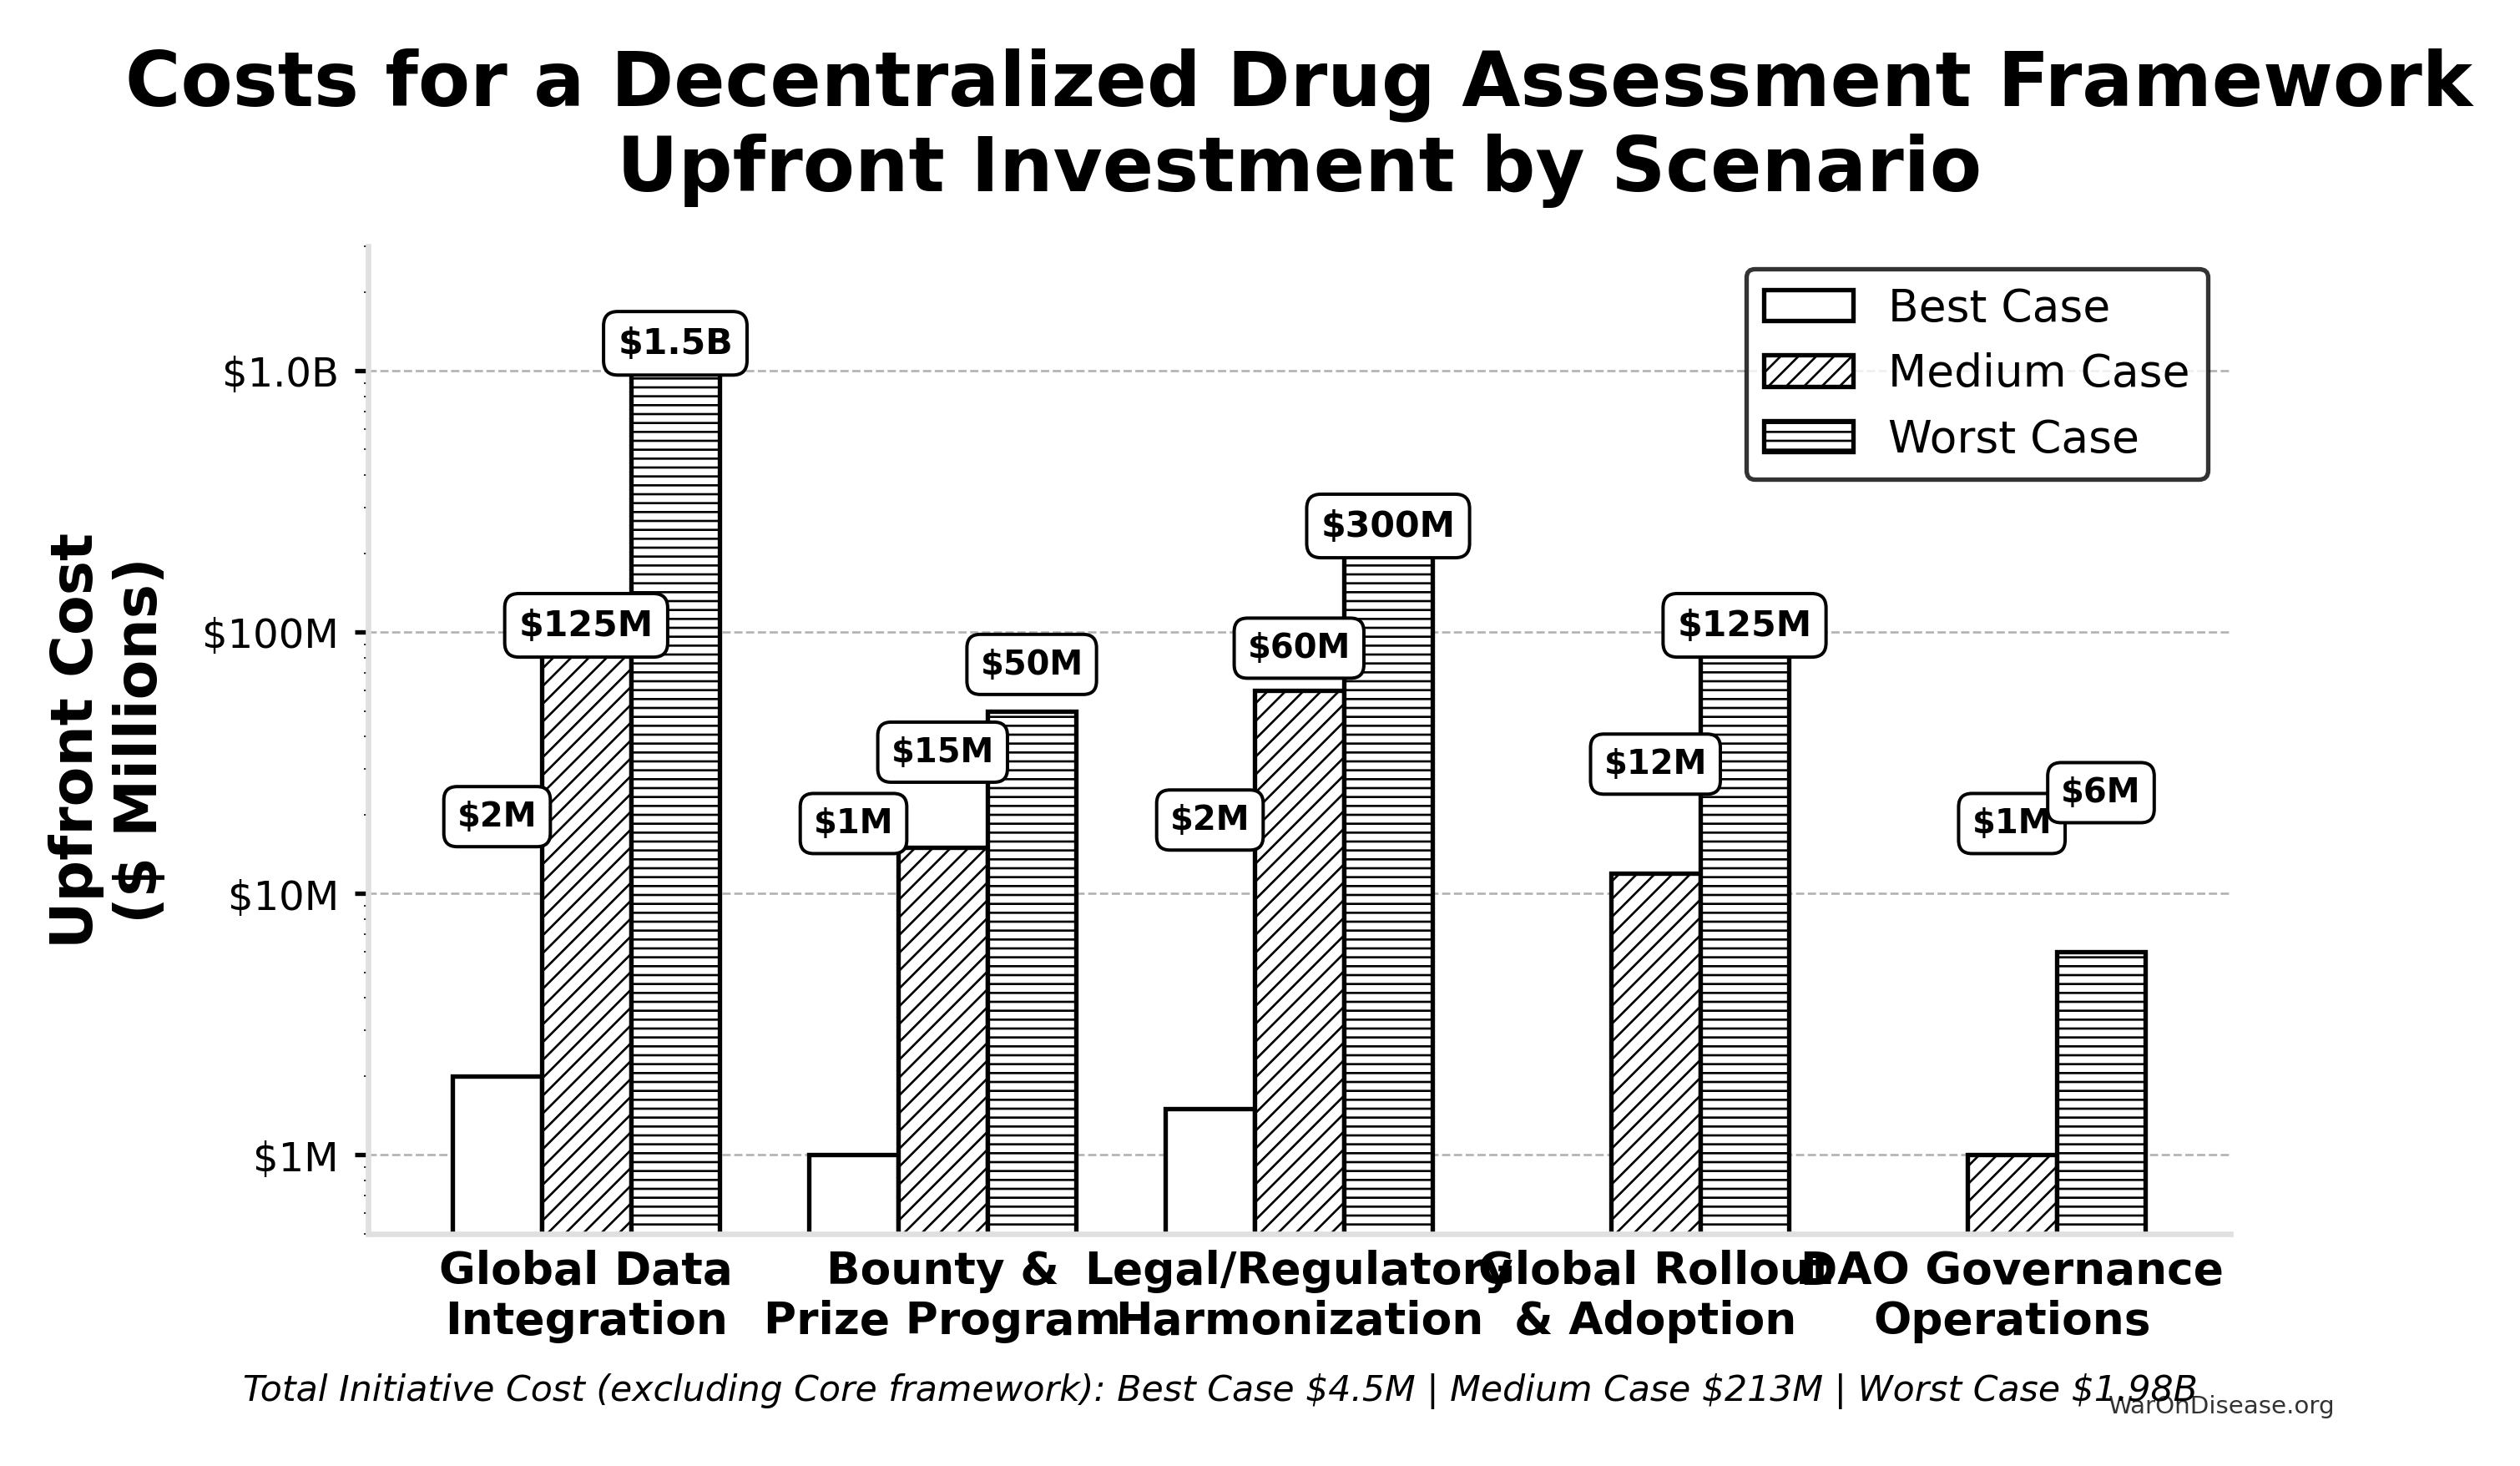
This table presents point estimates for each scenario, with the overall range of possibilities captured by comparing the Best, Medium, and Worst Case columns.
| Component | Best Case (Upfront / Annual) | Medium Case (Upfront / Annual) | Worst Case (Upfront / Annual) | Key Assumptions & Variables Driving Range |
|---|---|---|---|---|
| Global Data Integration | $2M / ~$0 | $125M / $10M | $1.5B / $150M | Success of AI/automation, standards adoption, #systems, vendor cooperation. |
| Bounty & Prize Program | $1M (Prizes) / ~$0 | $15M (Bounties) / $2M | $50M (Major Bounties) / $10M | Success of organic ecosystem growth vs. need to incentivize critical plugin/tool development via bounties. |
| Legal/Regulatory Harmonization | $1.5M / ~$0 | $60M / $3M | $300M / $30M | Effectiveness of AI legal tools, political will, complexity of global law. |
| Global Rollout & Adoption | ~$0 / ~$0 | $12M / $3M | $125M / $30M | Need for training/support beyond protocol adoption, user interface complexity. |
| Governance Operations | ~$0 / ~$0 | ~$1M / $0.3M | ~$6M / $1M | Automation level, need for audits, grants, core support staff. |
| — TOTAL — | ~$4.5M / ~$0 | ~$213M / ~$18.3M | ~$1.98B+ / ~$221M+ | Represents total initiative cost excluding Core framework build/ops. |
4.5.1 Interpretation
Even when pursuing efficient strategies, the potential cost for the full initiative for a decentralized framework (beyond the Core framework) varies dramatically based on real-world execution challenges. The Medium Case suggests upfront costs in the low hundreds of millions and annual costs in the low tens of millions, while the Worst Case pushes towards multi-billion dollar upfront figures and annual costs in the hundreds of millions, dominated by integration, plugin funding, and legal costs if automation and community efforts fall short.
4.5.2 Summary
Based on the detailed technical specification, a ROM estimate suggests:
- Initial Core framework Build (~2.5 years): ~$37.5 - $46M
- Annual Core framework Operations (at ~5M MAU scale): ~$11 - $26.5 Million (These framework operational costs are distinct from the financial flows of patient contributions and the NIH Trial Participation Cost Discount Fund, and also exclude plugin ecosystem costs not covered by protocol bounties)
The core protocol infrastructure build costs tens of millions; the broader global initiative (integration, legal frameworks, rollout) accounts for the larger cost estimates detailed in the scenario table above.
5 Benefit Analysis - Quantifying the Savings
This section quantifies the potential societal benefits of a decentralized FDA, focusing primarily on R&D cost savings and health outcome improvements.
5.1 Market Size and Impact
The global pharmaceutical and medical device R&D market is vast. Annual global spending on clinical trials is approximately $60B (95% CI: $50B-$75B). Much of this spending is made dramatically more efficient through protocol standardization. If such a framework enables even a fraction of these trials to use pragmatic designs, the economic impact will be substantial.
- Current Average Costs: Estimates suggest $2.6B (95% CI: $1.5B-$4B) to bring a new drug from discovery through FDA approval, spread across ~10 years.
- Clinical Trial Phase Breakdown:
- Phase I: $2 - $5 million/trial (smaller scale).
- Phase II: $10 - $50 million/trial (depending on disease area).
- Phase III: $100M - $500M/trial (large patient populations).
- Per-Patient Phase III Costs: Often $41K (95% CI: $20K-$120K) (site fees, overhead, staff, monitoring, data management).
5.2 Decentralized Trial Costs Modeled on Pragmatic Trials
Oxford RECOVERY: Achieved ~$500 (95% CI: $400-$2.5K). Key strategies included:
- Embedding trial protocols within routine hospital care.
- Minimizing overhead by leveraging existing staff/resources and electronic data capture.
- Focused, pragmatic trial designs.
Systematic Review Evidence: A systematic review of 64 embedded pragmatic clinical trials found a median cost per patient of $97 (95% CI: $19-$478)80. This confirms that low-cost execution is a replicable property of the pragmatic design, not an anomaly of any single trial.
ADAPTABLE Trial (PCORnet): The US-based ADAPTABLE trial143 ($14M (95% CI: $14M-$20M) / 15.1 thousand patients = $929 (95% CI: $929-$1.4K)/patient) provides a more representative benchmark for pragmatic trial costs in typical healthcare settings without emergency conditions.
Framework Cost Projection: Our projections use $929 (95% CI: $97-$3K)/patient based on ADAPTABLE. Confidence interval ($500-$3,000) captures range from RECOVERY-like efficiency to complex chronic disease trials.
Input: Pragmatic Trial Cost Distribution
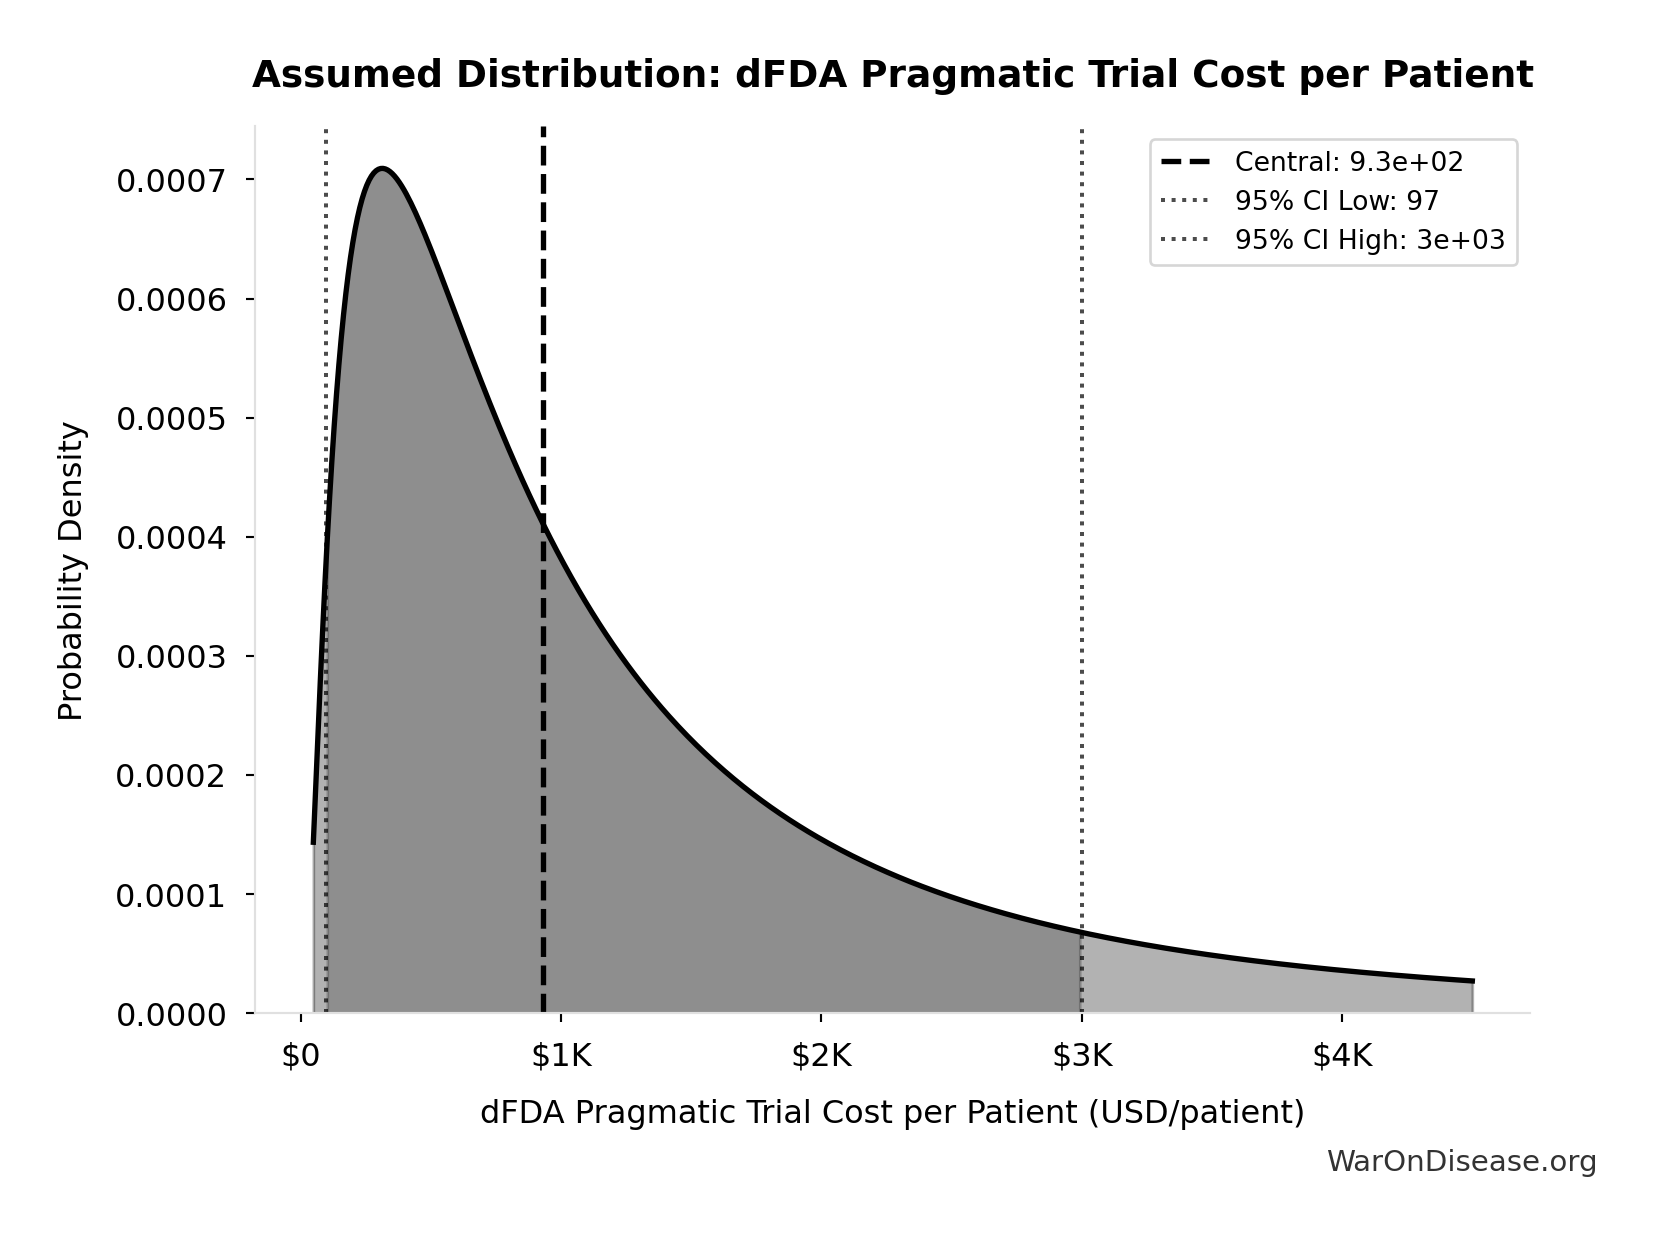
This chart shows the assumed probability distribution for this parameter. The shaded region represents the 95% confidence interval where we expect the true value to fall.
Extrapolation to New System:
- A well-integrated global framework could achieve $929 (95% CI: $97-$3K) in many cases, especially for pragmatic or observational designs.
- Up to ~44.1x (95% CI: 39.4x-89.1x) cost reduction is achievable by comparing pragmatic trial costs ($929 (95% CI: $97-$3K)) against traditional costs of $41K (95% CI: $20K-$120K).
The cost reduction factor:
\[ \begin{gathered} k_{reduce} \\ = \frac{Cost_{P3,pt}}{Cost_{pragmatic,pt}} \\ = \frac{\$41K}{\$929} \\ = 44.1 \end{gathered} \]
The percentage reduction:
\[ \begin{gathered} Reduce_{pct} \\ = 1 - \frac{Cost_{pragmatic,pt}}{Cost_{P3,pt}} \\ = 1 - \frac{\$929}{\$41K} \\ = 97.7\% \end{gathered} \]
5.3 Scope of Cost Reduction
This reduction applies to trials amenable to pragmatic design - approximately 70% of Phase III trial volume by patient count (chronic disease management, comparative effectiveness, dose optimization). First-in-human studies, novel mechanism trials, and high-risk interventions retain traditional controlled protocols. The confidence interval ($500-$3,000/patient) captures this heterogeneity: simple comparative studies approach RECOVERY-level efficiency while complex trials remain closer to traditional costs. The headline 97.7% (95% CI: 97%-99%) figure represents the weighted average across the addressable trial market, not a claim that every trial achieves this reduction.
5.4 Overall Savings
By Reducing Per-Patient Costs
- If a trial with 5,000 participants costs $929 (95% CI: $97-$3K)/patient, total cost is ~$6 million, versus $200 - $600 million under traditional models.
- This magnitude of savings can drastically reduce the total cost of clinical development.
For a trial with \(x\) participants, the total cost savings is:
\[ S_{\text{trial}}(x) = (c_t - c_d) \cdot x \]
Where:
- \(c_t\) is the traditional cost per patient ($41K (95% CI: $20K-$120K))
- \(c_d\) is the decentralized cost per patient ($929 (95% CI: $97-$3K))
For a trial with \(x = 5,000\) participants, savings are approximately:
\[(\text{Traditional} - \text{Pragmatic}) \times 5{,}000 \approx \$194\text{M per trial}\]
Volume of Trials & Speed
- Faster, cheaper trials allow more drug candidates, off-label uses, nutraceuticals, and personalized dosing strategies to be tested.
- Shorter development cycles reduce carrying costs and risk, further increasing ROI for sponsors.
Regulatory Savings
- A unified protocol standard with automated data audits cuts bureaucratic duplication across multiple countries, drastically lowering compliance costs.
Transparent, Standardized Environment
- The transparent nature of the protocol creates a standardized operating environment. Outcome data is visible across the ecosystem, enabling sponsors to benchmark their trial designs and optimize operational costs, further driving down R&D expenditure beyond the technical efficiencies of pragmatic trials.
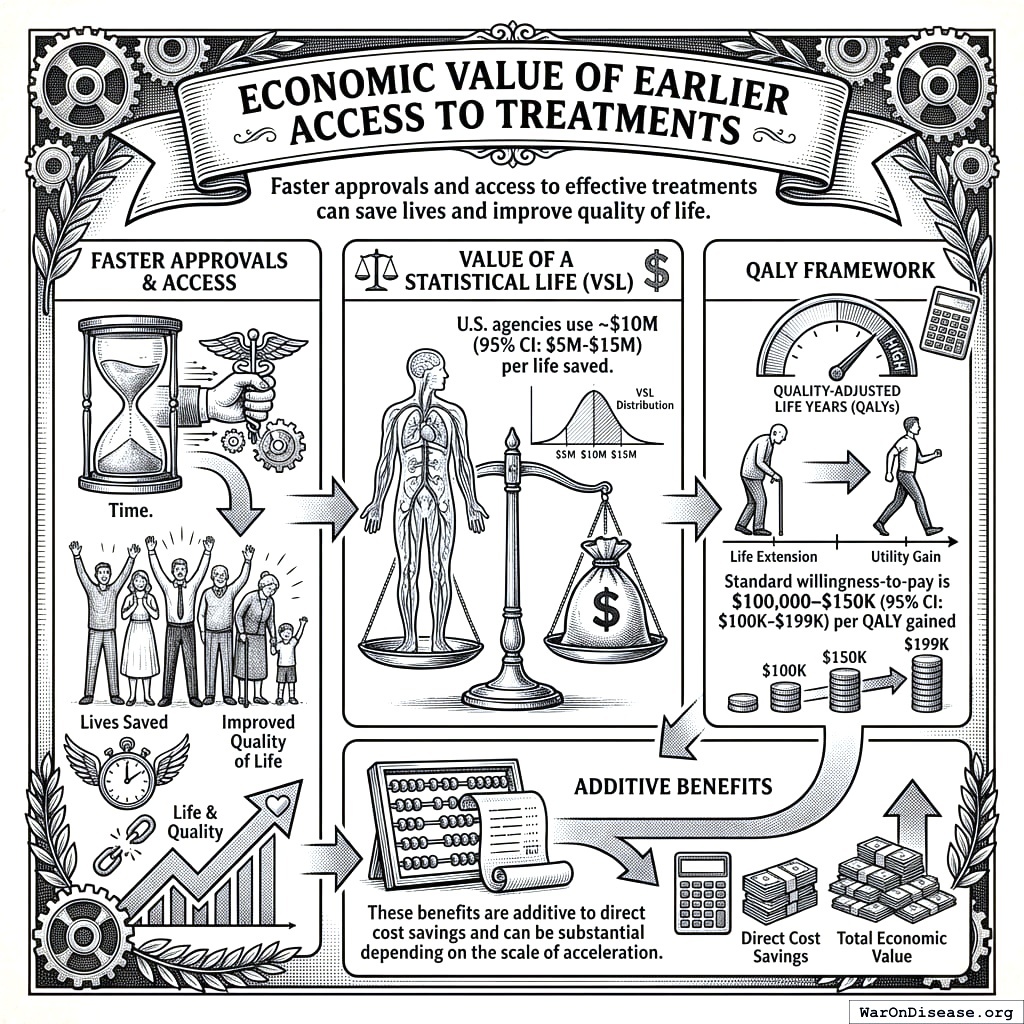
5.5 Economic Value of Earlier Access to Treatments
- Faster approvals and access to effective treatments can save lives and improve quality of life.
- Value of a Statistical Life (VSL): U.S. agencies use ~$10M (95% CI: $5M-$15M) per life saved.
- QALY Framework: Standard willingness-to-pay is $100,000–$150K (95% CI: $100K-$199K) per QALY gained.
- These benefits are additive to direct cost savings and can be substantial depending on the scale of acceleration.
5.6 Gross R&D Savings from a Decentralized FDA
- Parameter: Percentage reduction in addressable clinical trial costs due to a decentralized FDA.
- Central Estimate: 97.7% (95% CI: 97%-99%) (44.1x (95% CI: 39.4x-89.1x))
- Source/Rationale:
- Decentralized Clinical Trials (DCTs) demonstrate significant cost reductions144 through reduced site management, travel, and streamlined data collection.
- Empirical evidence: ADAPTABLE trial achieved $929 (95% CI: $929-$1.4K)/patient in routine US settings. Harvard meta-analysis of 108 pragmatic trials found median cost of $97 (95% CI: $19-$478)/patient.
- Our estimate: $929 (95% CI: $97-$3K)/patient (vs. $41K (95% CI: $20K-$120K) traditional). This deliberately uses ADAPTABLE as a conservative baseline; actual costs may be lower.
- Confidence interval captures uncertainty from complex chronic disease trials to highly efficient EHR-integrated designs.
The annual gross R&D savings can be calculated as:
\[ S_{\text{annual}} = \alpha \cdot R_d \]
Where:
- \(\alpha \in [0,1]\) is the cost reduction percentage (as decimal)
- \(R_d\) = $60B (95% CI: $50B-$75B) global clinical trial spending
Base Case Calculation:
Using 97.7% (95% CI: 97%-99%) cost reduction (pragmatic trial costs of $929 (95% CI: $97-$3K) vs traditional $41K (95% CI: $20K-$120K)):
\[
\begin{gathered}
Benefit_{RD,ann} \\
= Spending_{trials} \times Reduce_{pct} \\
= \$60B \times 97.7\% \\
= \$58.6B
\end{gathered}
\]
where:
\[
\begin{gathered}
Reduce_{pct} \\
= 1 - \frac{Cost_{pragmatic,pt}}{Cost_{P3,pt}} \\
= 1 - \frac{\$929}{\$41K} \\
= 97.7\%
\end{gathered}
\]
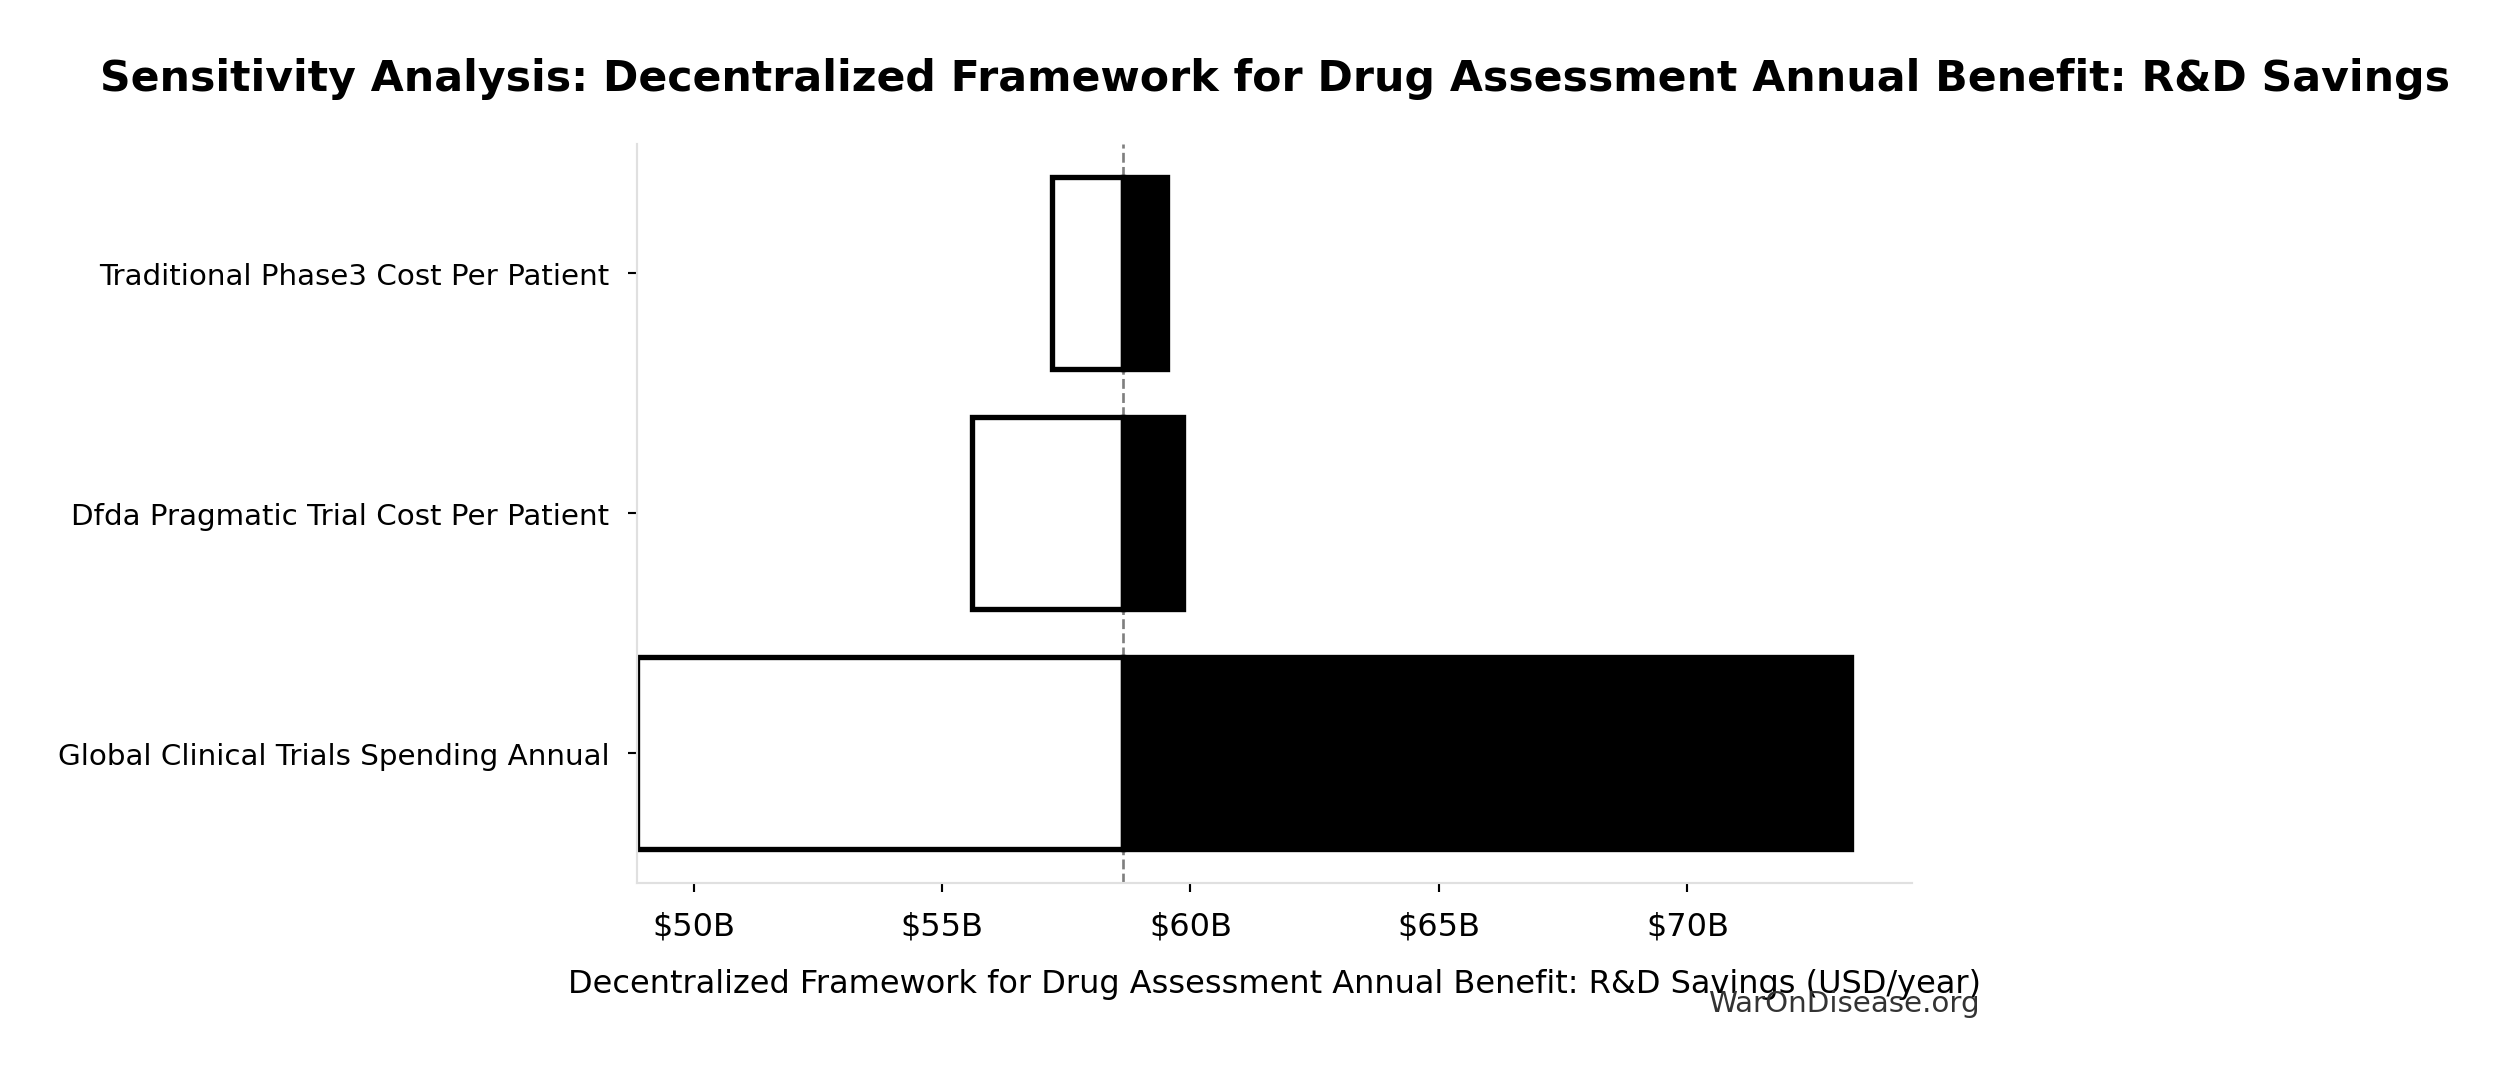
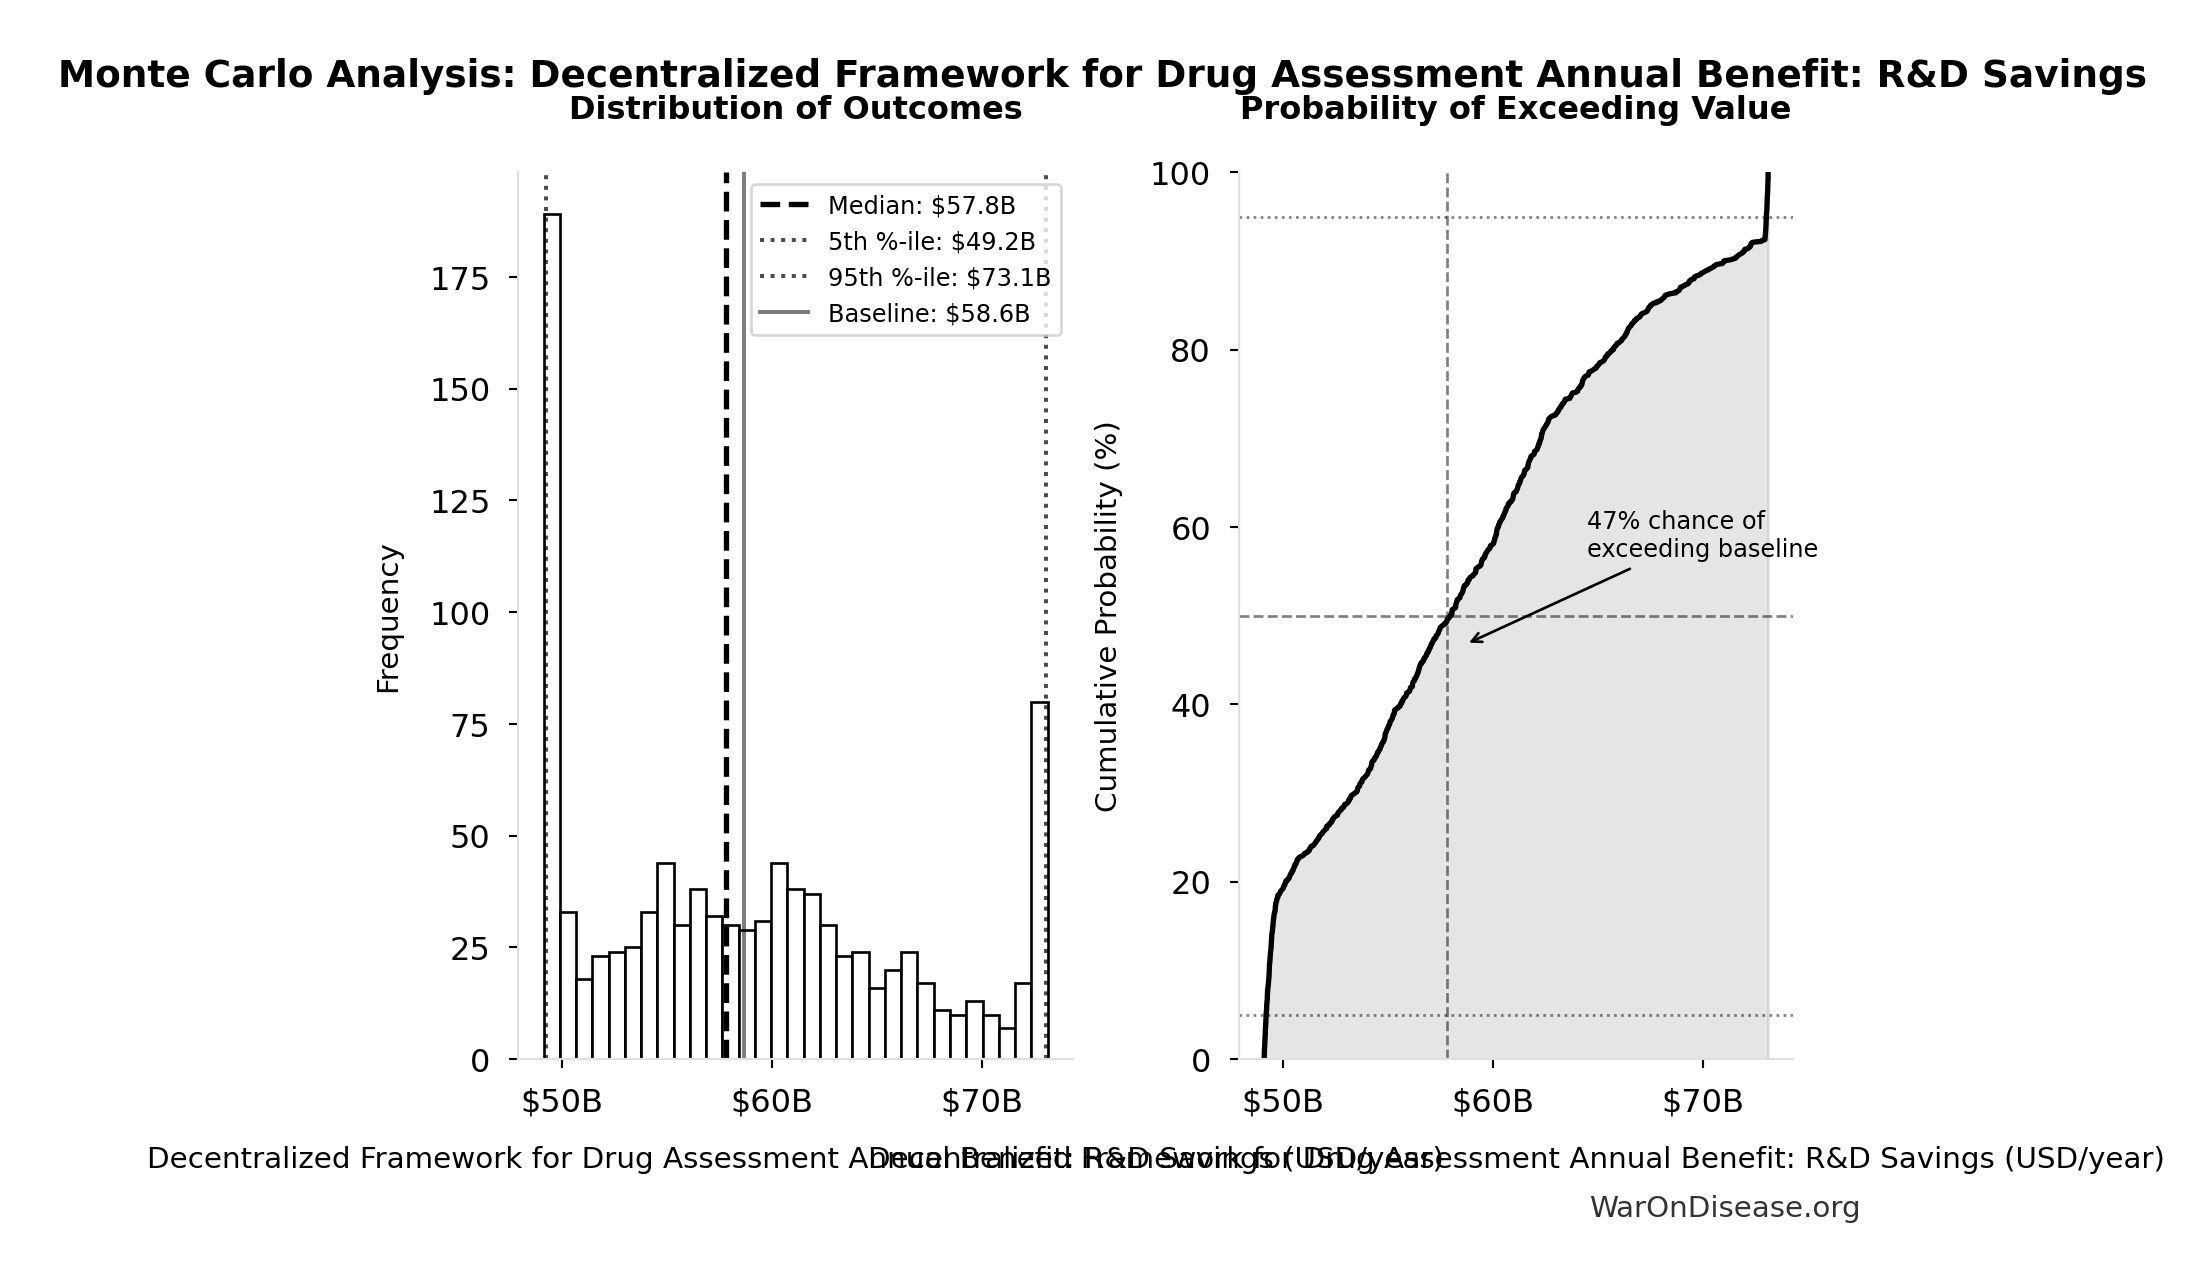
Uncertainty Analysis - R&D Savings:
Simulation Results Summary: Decentralized Framework for Drug Assessment Annual Benefit: R&D Savings
| Statistic | Value |
|---|---|
| Baseline (deterministic) | $58.6B |
| Mean (expected value) | $58.8B |
| Median (50th percentile) | $57.8B |
| Standard Deviation | $7.66B |
| 90% Range (5th-95th percentile) | [$49.2B, $73.1B] |
The histogram shows the distribution of Decentralized Framework for Drug Assessment Annual Benefit: R&D Savings across 10,000 Monte Carlo simulations. The CDF (right) shows the probability of the outcome exceeding any given value, which is useful for risk assessment.
5.7 Post-Safety Efficacy Lag Elimination
5.8 Relative Magnitude
Efficacy lag elimination (8.2 years (95% CI: 4.85 years-11.5 years)) is the smaller of the two timeline shift components. Discovery acceleration from 12.3x (95% CI: 4.2x-61.4x) trial capacity contributes 204 years (95% CI: 123 years-350 years), over 10× more health impact. This section details the efficacy lag component; see The Discovery Capacity Model for the dominant component.
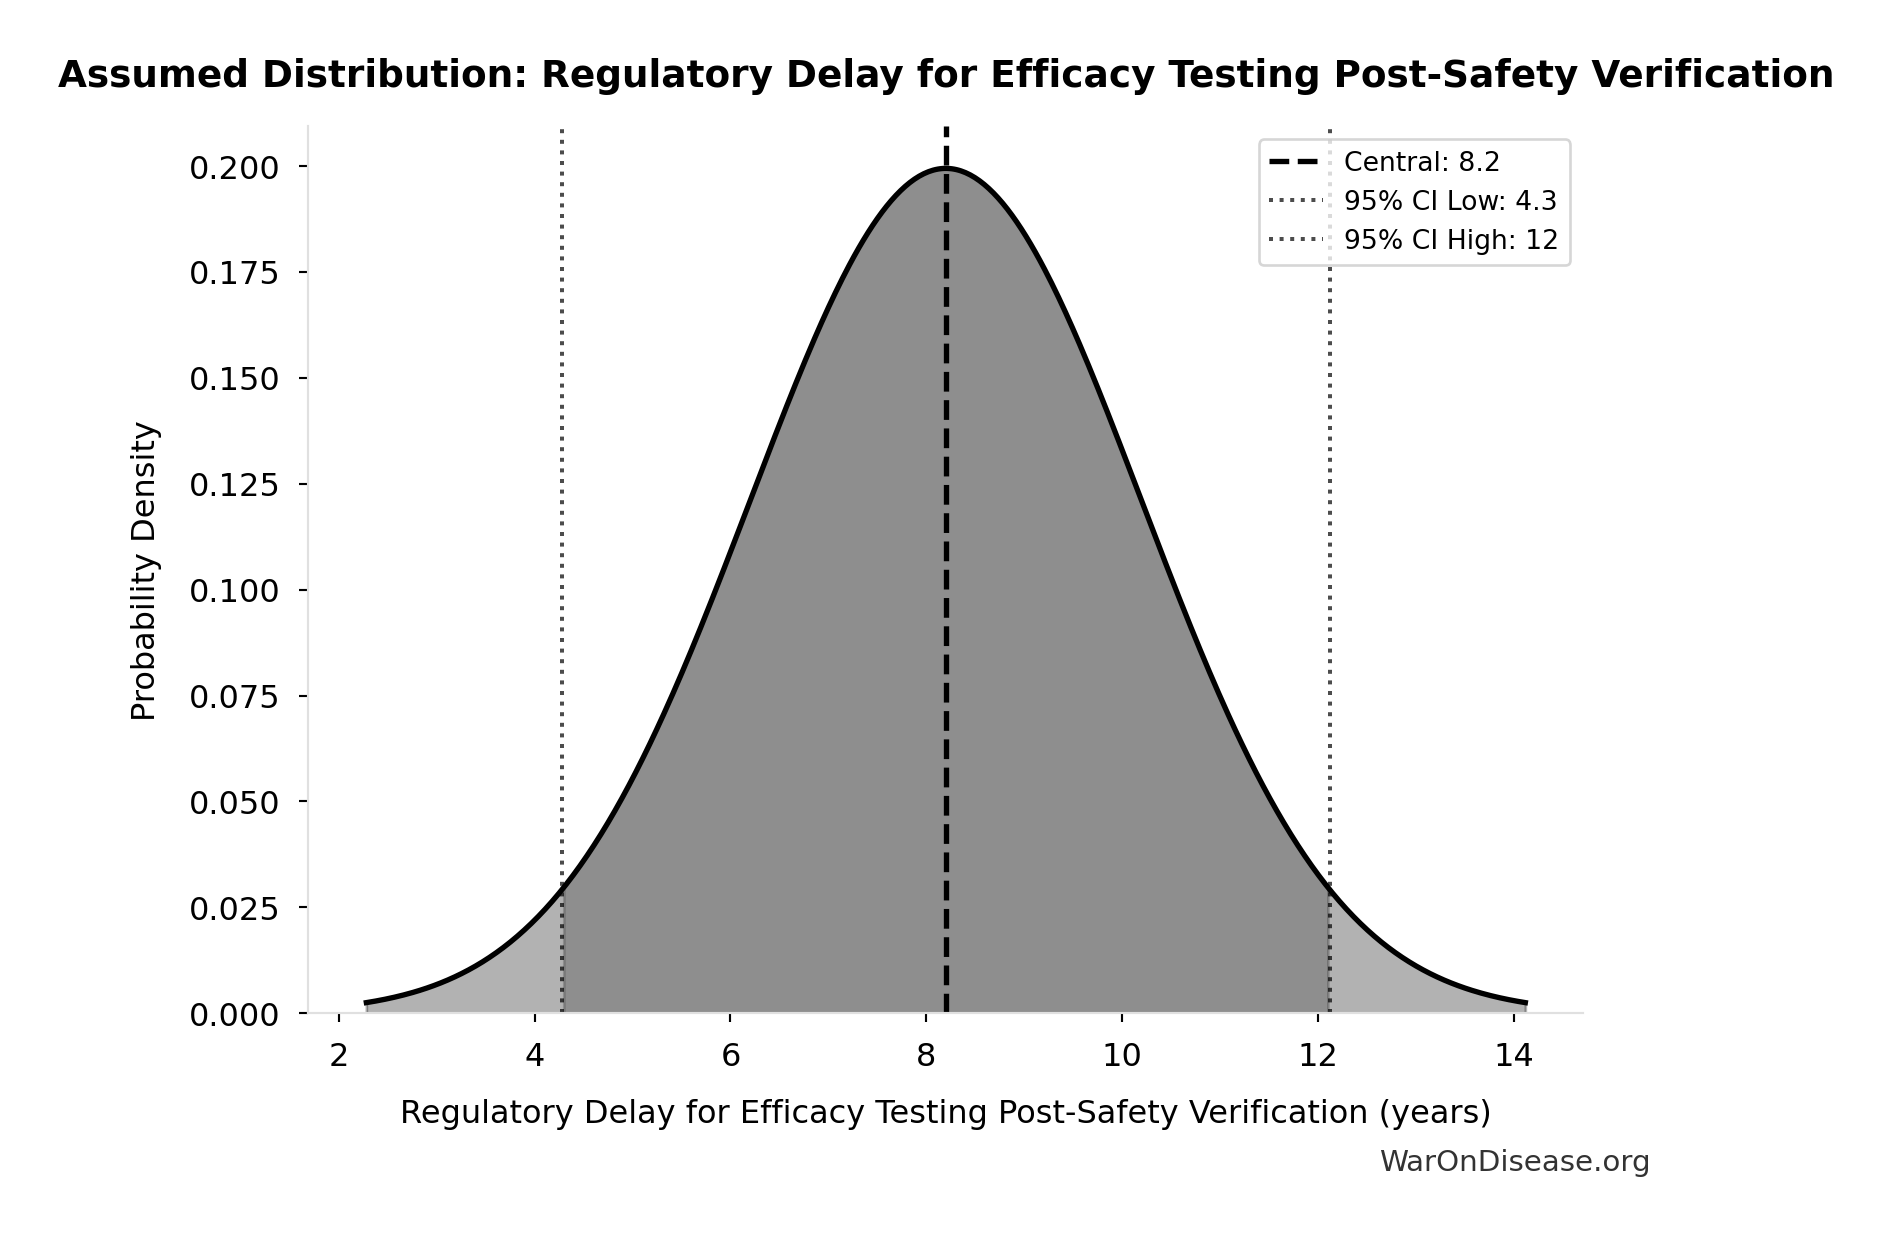
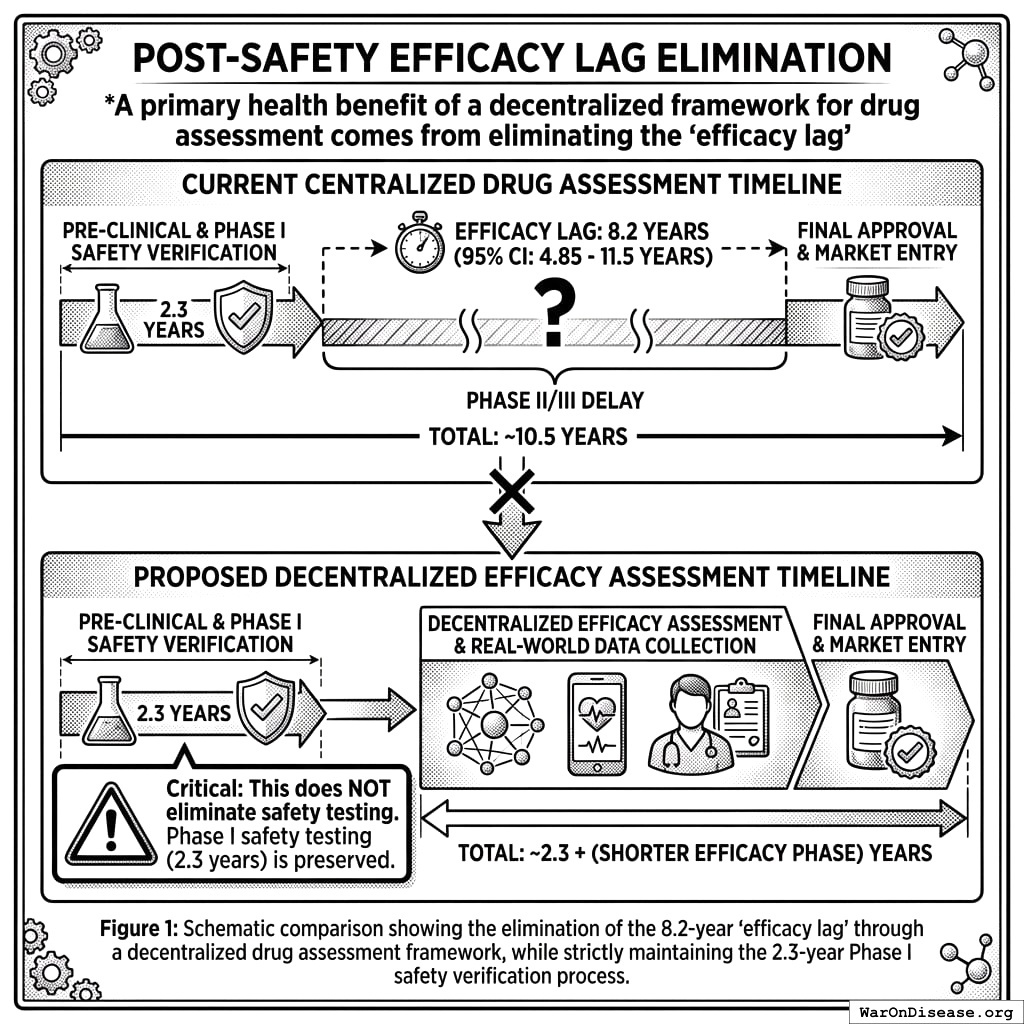
One of two health benefits of a decentralized FDA comes from eliminating the “efficacy lag”, the 8.2 years (95% CI: 4.85 years-11.5 years) Phase II/III delay between Phase I safety verification and final approval. Critical: This does NOT eliminate safety testing. Phase I safety testing (2.3 years) is preserved.
5.8.1 The Efficacy Lag Problem
A comprehensive quantitative analysis of post-safety efficacy lag costs (1962-2024) found:
- Total Deaths: 416 million deaths (95% CI: 225 million deaths-630 million deaths) eventually avoidable deaths over 8.2 years (95% CI: 4.85 years-11.5 years) efficacy lag (1962-2024)
- Total DALYs: 7.94 billion (95% CI: 4.43 billion-12.1 billion) Disability-Adjusted Life Years lost
- Total Timeline Shift: One-time 8.2 years (95% CI: 4.85 years-11.5 years) acceleration in disease eradication
The analysis shows that for every 1 unit of harm the FDA prevents through safety testing, it generates 3.07k (95% CI: 2.88k-3.12k) units of harm through efficacy delay (Type II vs. Type I error ratio).
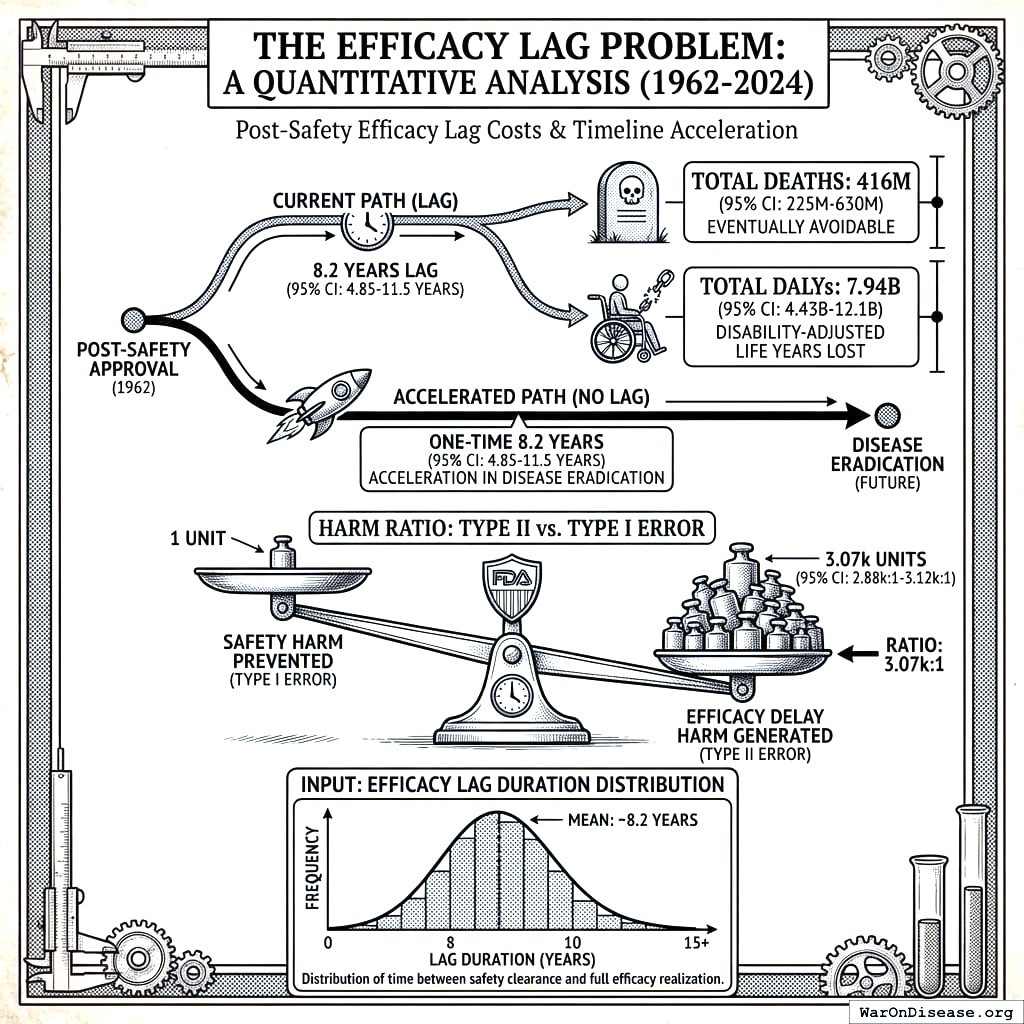
Input: Efficacy Lag Duration Distribution
This chart shows the assumed probability distribution for this parameter. The shaded region represents the 95% confidence interval where we expect the true value to fall.
5.8.2 How a Decentralized Framework Eliminates the Efficacy Lag
Such a framework provides provisional access post-Phase I via trial participation:
- Phase I Safety Testing: Maintained at 2.3 years (no change)
- Post-Phase I Access: Patients can access drugs through trial participation immediately after safety verification
- Continuous Efficacy Monitoring: Real-world evidence replaces the 8.2 years (95% CI: 4.85 years-11.5 years) pre-market efficacy delay
This eliminates the post-safety efficacy lag (the Phase II/III portion, while preserving Phase I safety testing) by enabling real-world evidence collection during trials.
5.8.3 Quantified Benefits (Efficacy Lag Component Only)
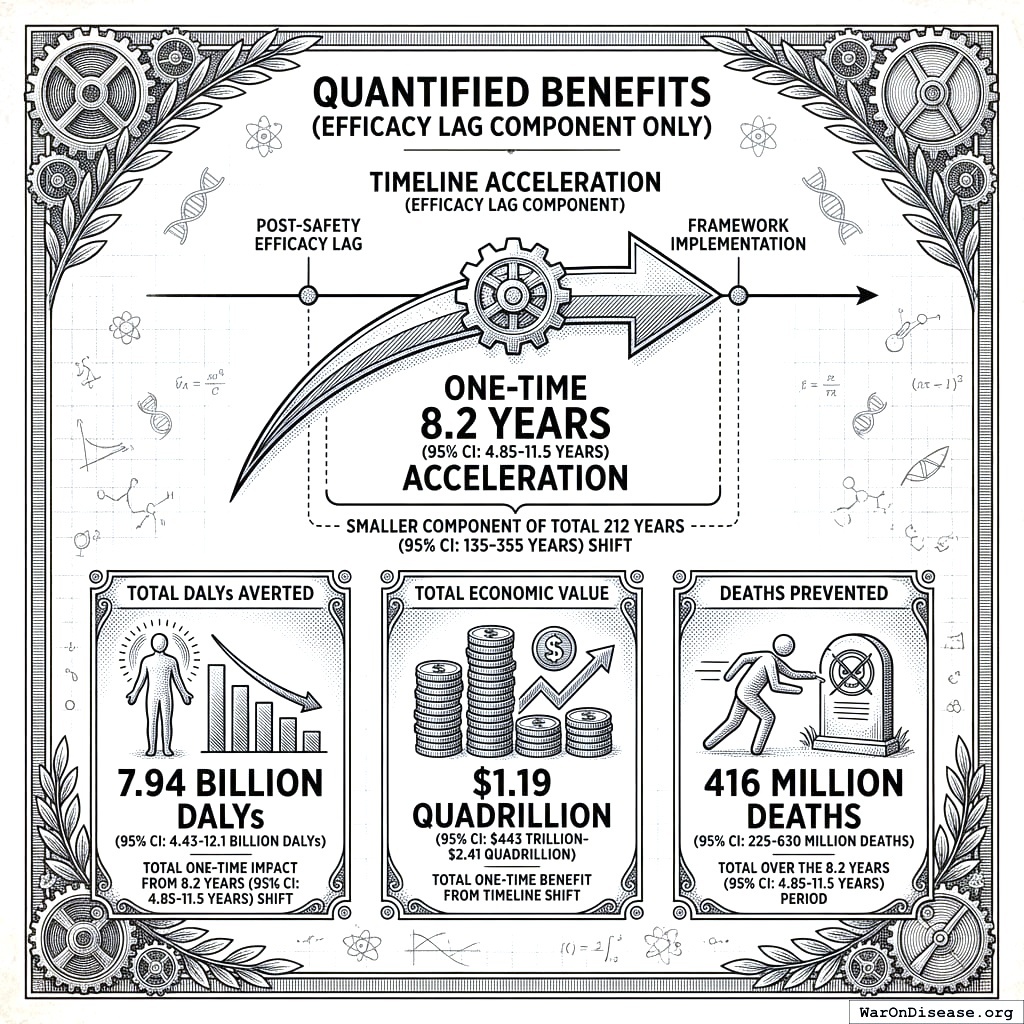
The elimination of the post-safety efficacy lag by such a framework achieves a one-time 8.2 years (95% CI: 4.85 years-11.5 years) timeline acceleration (the smaller component of the total 212 years (95% CI: 135 years-355 years) shift):
- Total DALYs Averted: 7.94 billion DALYs (95% CI: 4.43 billion DALYs-12.1 billion DALYs) (total one-time impact from 8.2 years (95% CI: 4.85 years-11.5 years) timeline shift)
- Total Economic Value: $1.19 quadrillion (95% CI: $443T-$2.41 quadrillion) (7.94 billion DALYs (95% CI: 4.43 billion DALYs-12.1 billion DALYs) at $150,000/DALY, cumulative over 8.2 years (95% CI: 4.85 years-11.5 years) of accelerated treatment access)
- Deaths Prevented: 416 million deaths (95% CI: 225 million deaths-630 million deaths) (total over the 8.2 years (95% CI: 4.85 years-11.5 years) period)
\[
DALYs_{lag} = YLL_{lag} + YLD_{lag} = 7.07B + 873M = 7.94B
\]
where:
\[
\begin{gathered}
YLL_{lag} \\
= Deaths_{lag} \times (LE_{global} - Age_{death,delay}) \\
= 416M \times (79 - 62) \\
= 7.07B
\end{gathered}
\]
where:
\[
\begin{gathered}
Deaths_{lag} \\
= T_{lag} \times Deaths_{disease,daily} \times 338 \\
= 8.2 \times 150{,}000 \times 338 \\
= 416M
\end{gathered}
\]
where:
\[
\begin{gathered}
YLD_{lag} \\
= Deaths_{lag} \times T_{suffering} \times DW_{chronic} \\
= 416M \times 6 \times 0.35 \\
= 873M
\end{gathered}
\]
\[
\begin{gathered}
Value_{lag} \\
= DALYs_{lag} \times Value_{QALY} \\
= 7.94B \times \$150K \\
= \$1190T
\end{gathered}
\]
where:
\[
DALYs_{lag} = YLL_{lag} + YLD_{lag} = 7.07B + 873M = 7.94B
\]
where:
\[
\begin{gathered}
YLL_{lag} \\
= Deaths_{lag} \times (LE_{global} - Age_{death,delay}) \\
= 416M \times (79 - 62) \\
= 7.07B
\end{gathered}
\]
where:
\[
\begin{gathered}
Deaths_{lag} \\
= T_{lag} \times Deaths_{disease,daily} \times 338 \\
= 8.2 \times 150{,}000 \times 338 \\
= 416M
\end{gathered}
\]
where:
\[
\begin{gathered}
YLD_{lag} \\
= Deaths_{lag} \times T_{suffering} \times DW_{chronic} \\
= 416M \times 6 \times 0.35 \\
= 873M
\end{gathered}
\]
\[ \begin{gathered} Deaths_{lag} \\ = T_{lag} \times Deaths_{disease,daily} \times 338 \\ = 8.2 \times 150{,}000 \times 338 \\ = 416M \end{gathered} \]
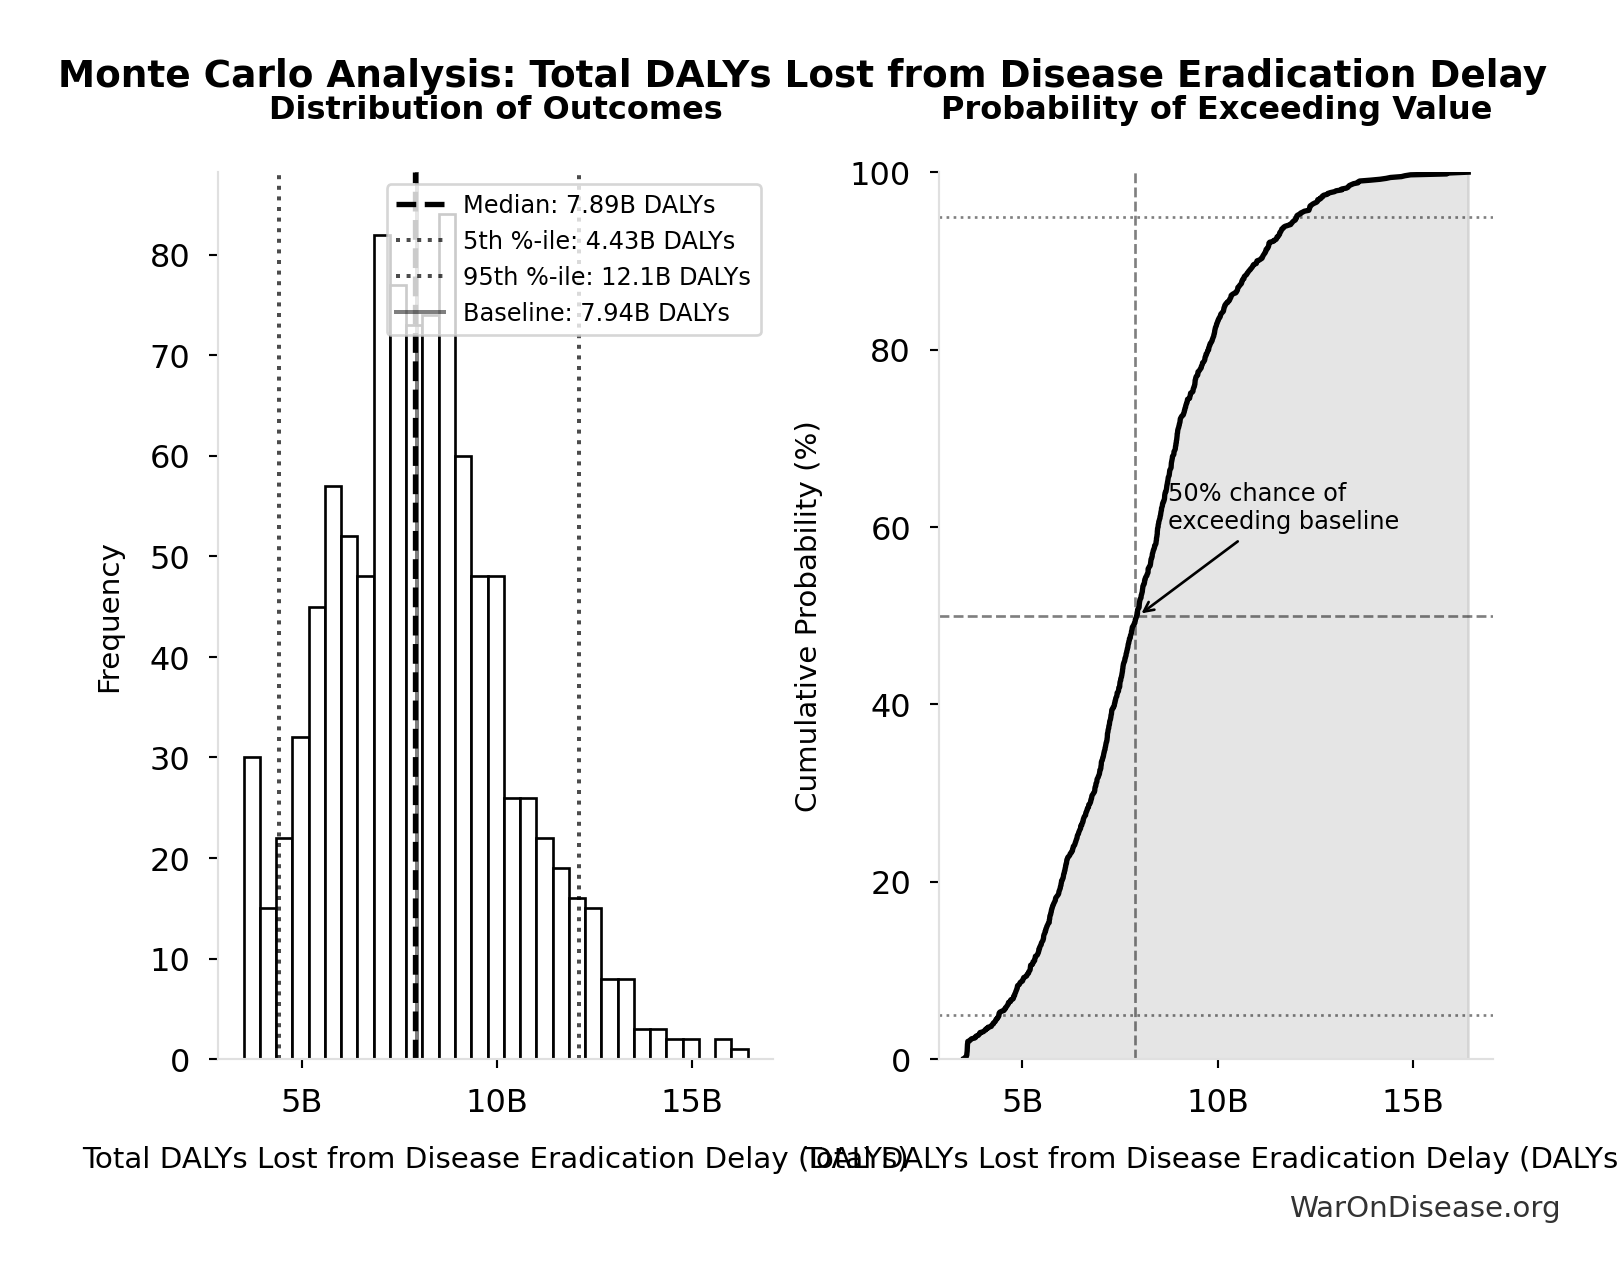
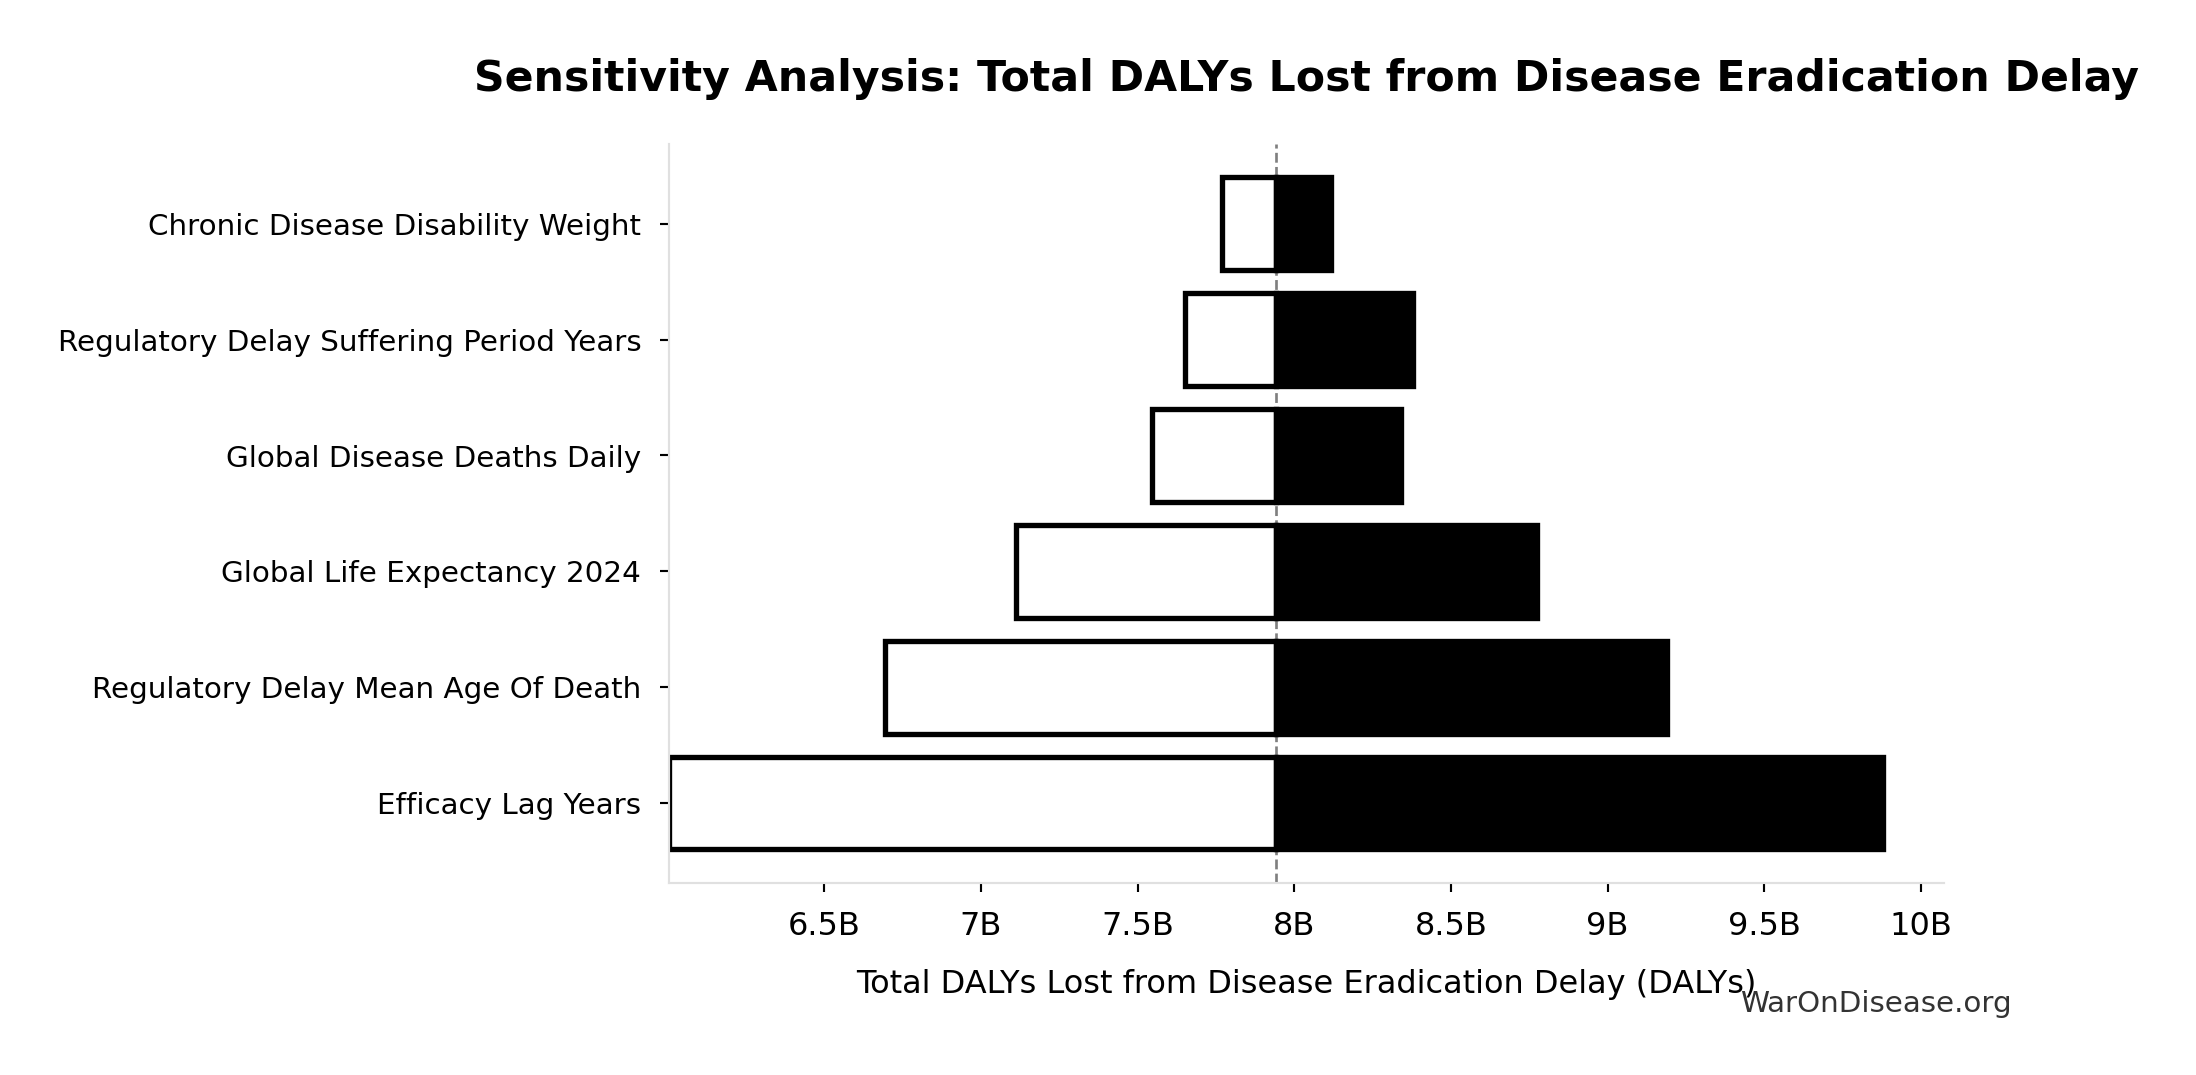
5.8.4 Efficacy Lag Elimination - Uncertainty Analysis
Simulation Results Summary: Total DALYs Lost from Disease Eradication Delay
| Statistic | Value |
|---|---|
| Baseline (deterministic) | 7.94 billion |
| Mean (expected value) | 8.05 billion |
| Median (50th percentile) | 7.89 billion |
| Standard Deviation | 2.31 billion |
| 90% Range (5th-95th percentile) | [4.43 billion, 12.1 billion] |
The histogram shows the distribution of Total DALYs Lost from Disease Eradication Delay across 10,000 Monte Carlo simulations. The CDF (right) shows the probability of the outcome exceeding any given value, which is useful for risk assessment.
This represents the health benefits from eliminating the post-safety efficacy lag only. The efficacy lag (8.2 years (95% CI: 4.85 years-11.5 years)) is one of two components of the total timeline shift:
- Efficacy lag elimination: 8.2 years (95% CI: 4.85 years-11.5 years) (this section)
- Trial capacity/discovery acceleration: 204 years (95% CI: 123 years-350 years) (from 12.3x (95% CI: 4.2x-61.4x) more trials)
The combined total timeline shift is 212 years (95% CI: 135 years-355 years), yielding 10.7 billion deaths (95% CI: 7.4 billion deaths-16.2 billion deaths) and 565 billion DALYs (95% CI: 361 billion DALYs-877 billion DALYs). See The Receipts for the combined totals.
For detailed methodology and assumptions on efficacy lag, see https://invisible-graveyard.warondisease.org.
5.9 Safety and Risk Management
Common concern: Won’t faster trials with lower costs compromise safety?
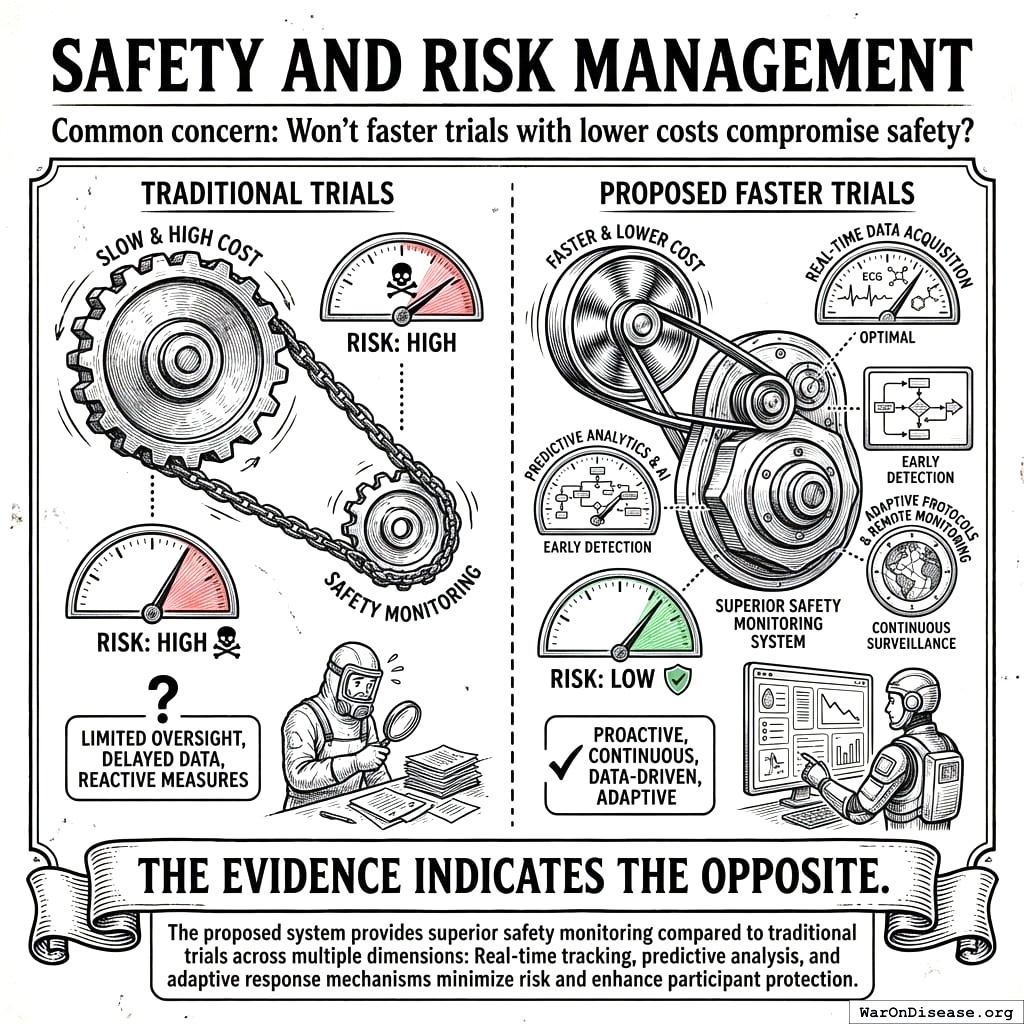
The evidence indicates the opposite. The proposed system provides superior safety monitoring compared to traditional trials across multiple dimensions.
5.9.1 Current System Limitations: Dangerously Blind to Real-World Harms
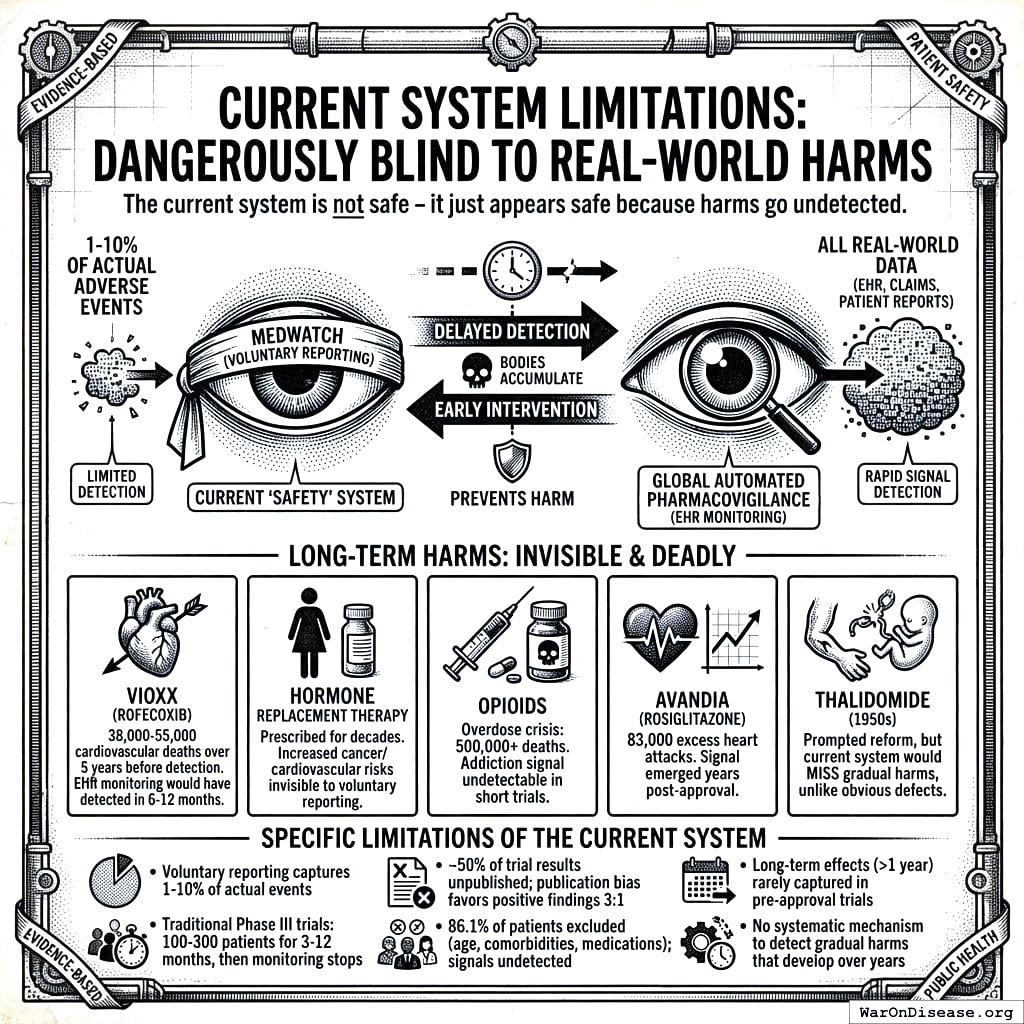
5.10 Caution
The current system is not safe - it just appears safe because harms go undetected.
The FDA’s voluntary adverse event reporting system (MedWatch) captures only 1-10% of actual adverse events. Long-term harms that develop gradually over years - the most insidious and deadly kind - are virtually invisible:
- Vioxx (rofecoxib): Caused 38,000-55,000 cardiovascular deaths over 5 years before detection through voluntary reporting. With automated EHR pharmacovigilance, the elevated MI risk would have been detected within 6-12 months.
- Hormone Replacement Therapy: Prescribed for decades before the Women’s Health Initiative revealed increased cancer and cardiovascular risk - risks invisible to voluntary reporting
- Opioids: The overdose crisis killed 500,000+ Americans; the addiction signal was undetectable in short trials with cherry-picked populations
- Avandia (rosiglitazone): 83,000 excess heart attacks estimated before restrictions; signal emerged years post-approval
- Thalidomide (1950s): The disaster that prompted regulatory reform - yet the current system would still miss a thalidomide-like harm if it manifested gradually rather than as obvious birth defects
The current “safety” system doesn’t prevent harm - it delays detection until bodies accumulate. A global automated pharmacovigilance system with continuous EHR monitoring would detect these signals in months, not years or decades.
Specific limitations of the current system:
- Voluntary adverse event reporting captures only 1-10% of actual events
- Traditional Phase III trials test 100-300 patients for 3-12 months, then monitoring stops
- Approximately 50% of trial results go unpublished, with publication bias favoring positive findings 3:1
- 86.1% of patients excluded due to age, comorbidities, or medications - safety signals in these populations go undetected
- Long-term effects (>1 year) rarely captured in pre-approval trials
- No systematic mechanism to detect gradual harms that develop over years
5.10.1 Proposed System Safety Advantages
- Preserved Phase I Safety Testing: Rigorous Phase I safety testing (~2.3 years) is maintained. What changes is eliminating the 8.2 years (95% CI: 4.85 years-11.5 years) efficacy delay after safety is verified.
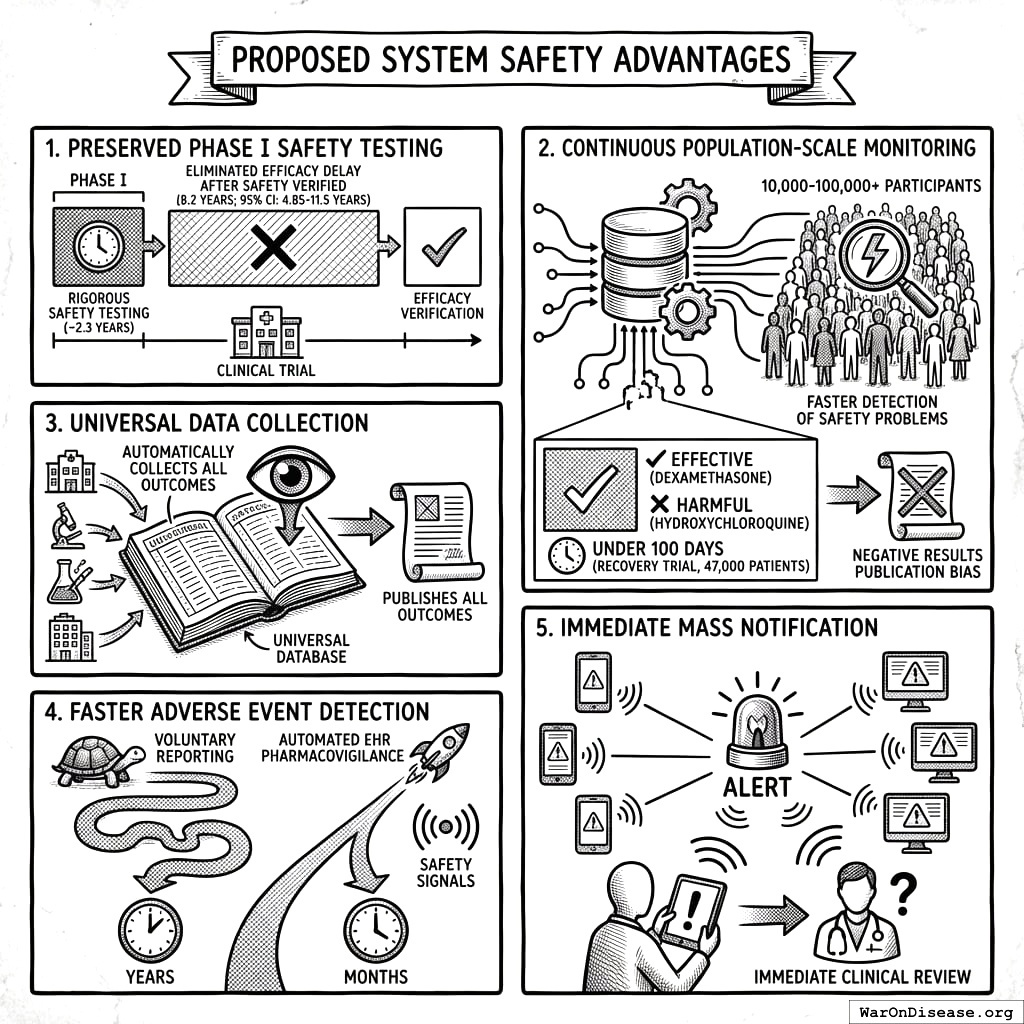
Continuous Population-Scale Monitoring: Pragmatic trials with 10,000-100,000+ participants monitored continuously through EHR integration detect safety problems faster than small, time-limited traditional trials. The RECOVERY trial identified both effective treatments (dexamethasone) and harmful ones (hydroxychloroquine) in under 100 days with 47,000 patients.
Universal Data Collection: The system automatically collects and publishes outcome data on all treatments, eliminating the publication bias that currently hides negative results.
Faster Adverse Event Detection: Automated EHR pharmacovigilance detects safety signals in months rather than the years required by voluntary reporting systems.
Immediate Mass Notification: When safety signals are detected, all patients taking the drug receive automated alerts through patient portals, enabling immediate clinical review.
5.10.2 Detection Timeline Comparison
The following table quantifies how automated EHR monitoring would have changed outcomes for major drug safety disasters:
| Drug | Harm | Voluntary Reporting Detection | Projected EHR Detection | Deaths During Delay |
|---|---|---|---|---|
| Vioxx | Cardiovascular events | 5 years (1999-2004) | 6-12 months | 38,000-55,000 |
| Avandia | Heart attacks | 8 years post-approval | 12-18 months | ~83,000 excess events |
| Opioids | Addiction/overdose | Decades | 2-3 years | 500,000+ deaths |
| HRT | Cancer/cardiovascular | 40+ years | 3-5 years | Unknown (millions affected) |
Why the difference? Automated EHR surveillance compares treated patients to matched controls continuously. The Vioxx cardiovascular signal would trigger statistical alerts after ~5,000 prescriptions (1.2% elevated event rate vs. expected background). Voluntary reporting requires doctors to notice, remember, and file paperwork, capturing only 1-10% of events.
5.10.3 Comparative Safety Surveillance
| Safety Dimension | Traditional Trials | Pragmatic Trials + EHR Monitoring |
|---|---|---|
| Sample size | 100-300 patients | 10,000-100,000+ patients |
| Patient selection | 86.1% excluded | All volunteers (real-world populations) |
| Monitoring duration | 3-12 months (then stops) | Continuous via EHR (indefinite) |
| Publication rate | ~50% unpublished | 100% automatically published |
| Adverse event detection | Voluntary reporting (1-10% capture) | Automated surveillance (100% capture) |
5.10.4 Pooled Liability Insurance
The framework includes pooled liability coverage for sponsors, reducing individual company risk while ensuring patient compensation for adverse events. This removes a major barrier to trial participation for smaller sponsors while maintaining accountability.
Type II Error Dominance: For every person protected from an unsafe drug (Type I error prevention), 3.07k (95% CI: 2.88k-3.12k) people die from delayed access to beneficial treatments (Type II errors). The current system prevents harm from unsafe drugs, but causes 3.07k (95% CI: 2.88k-3.12k) more deaths through delays. Phase I safety testing is preserved in this framework; the ratio quantifies the cost of the efficacy lag, not safety testing. (See Historical Validation for the thalidomide context.)
6 ROI Analysis for a Decentralized FDA
6.1 Monte Carlo Distributions
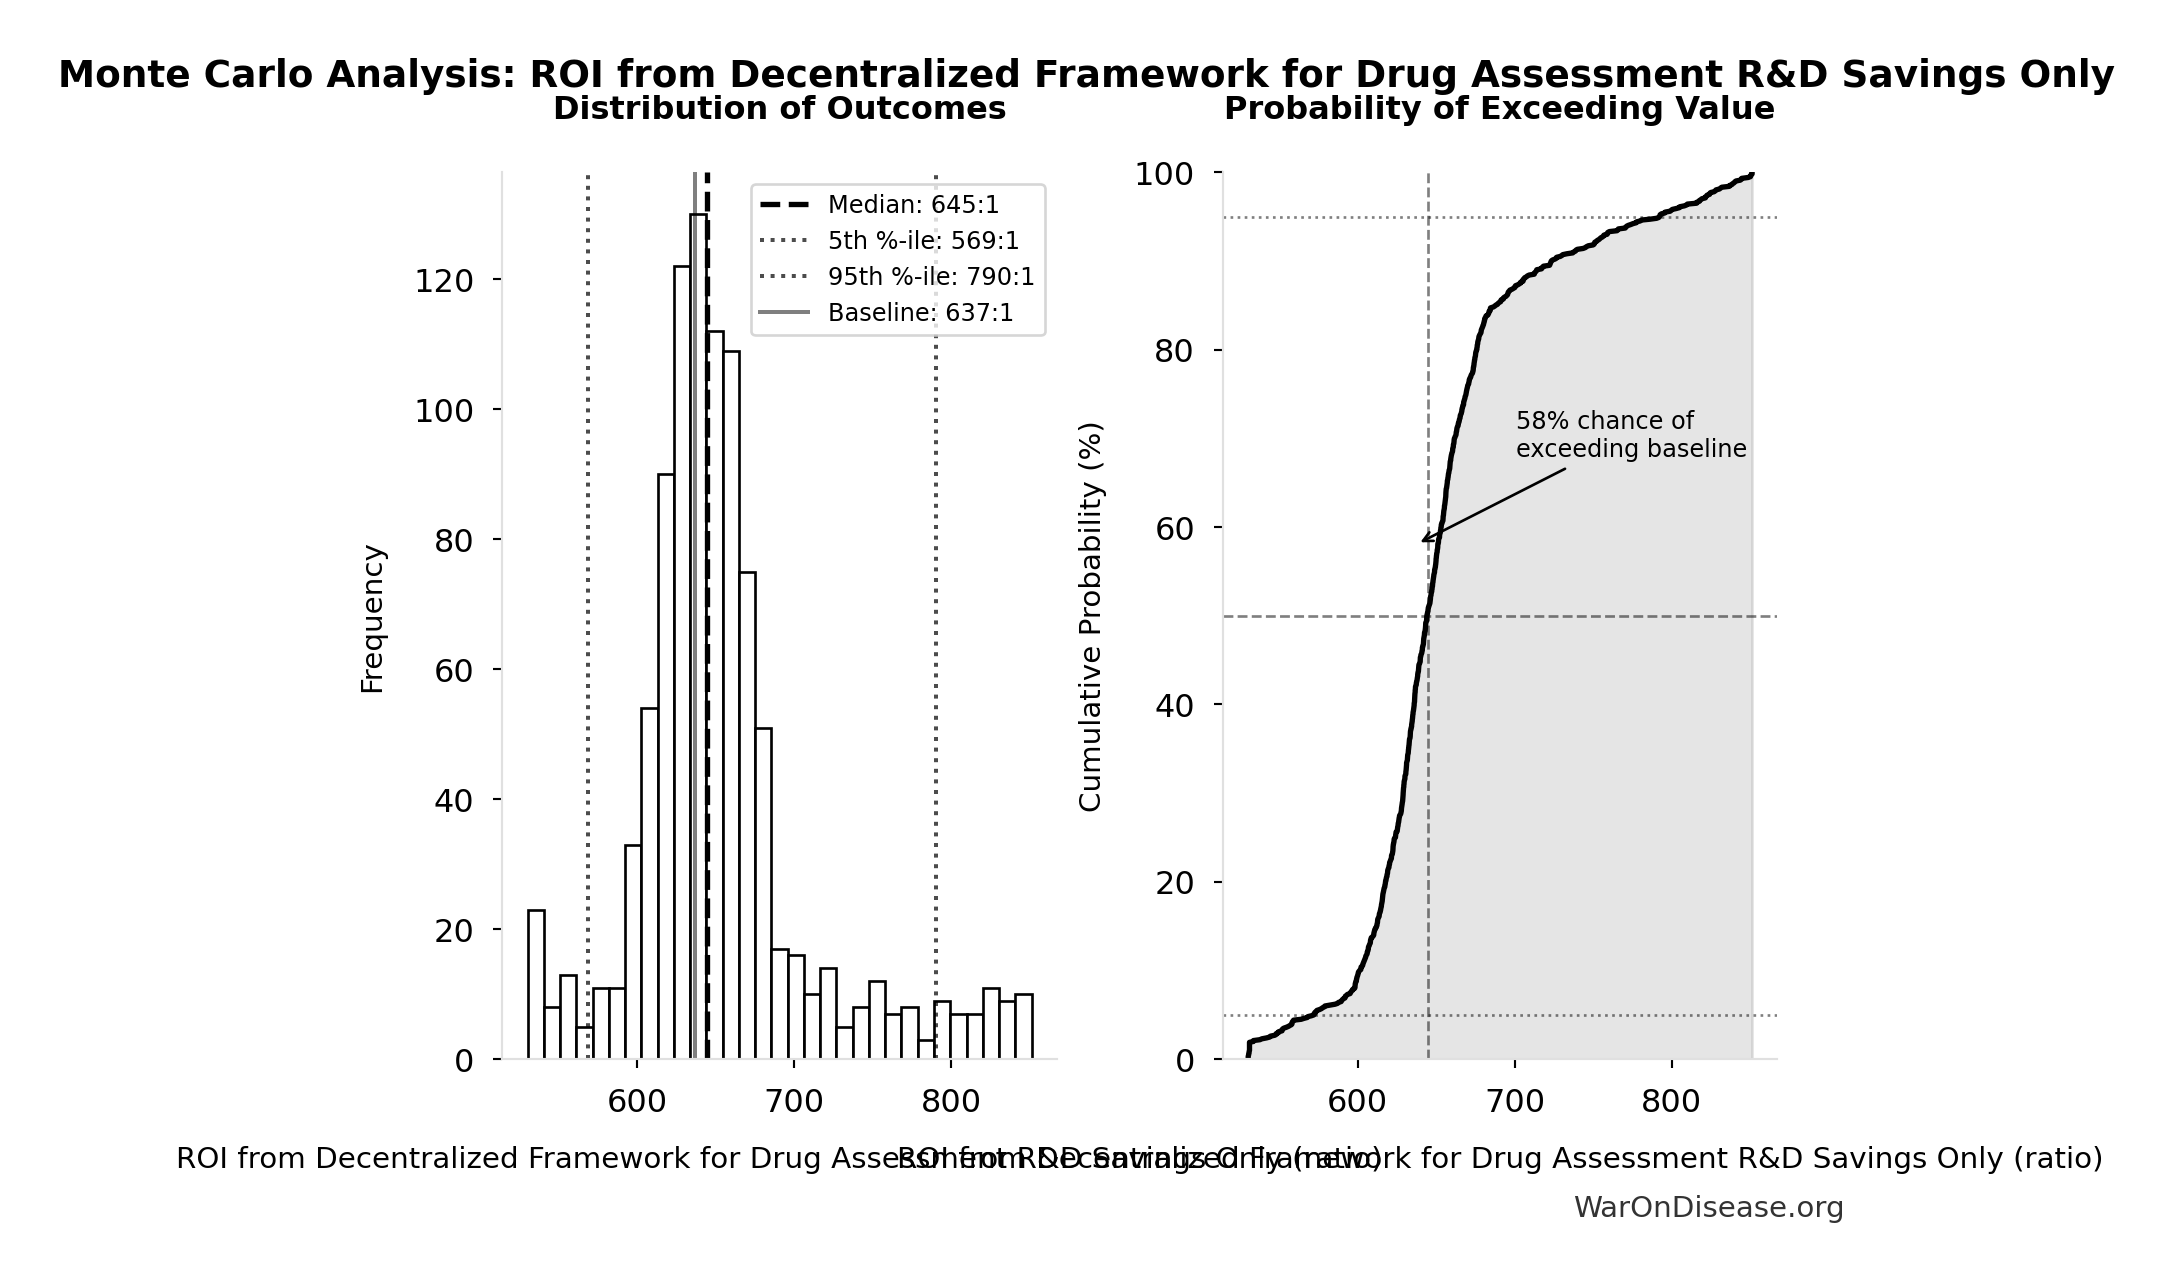
Simulation Results Summary: ROI from Decentralized Framework for Drug Assessment R&D Savings Only
| Statistic | Value |
|---|---|
| Baseline (deterministic) | 637:1 |
| Mean (expected value) | 653:1 |
| Median (50th percentile) | 645:1 |
| Standard Deviation | 58.4:1 |
| 90% Range (5th-95th percentile) | [569:1, 790:1] |
The histogram shows the distribution of ROI from Decentralized Framework for Drug Assessment R&D Savings Only across 10,000 Monte Carlo simulations. The CDF (right) shows the probability of the outcome exceeding any given value, which is useful for risk assessment.
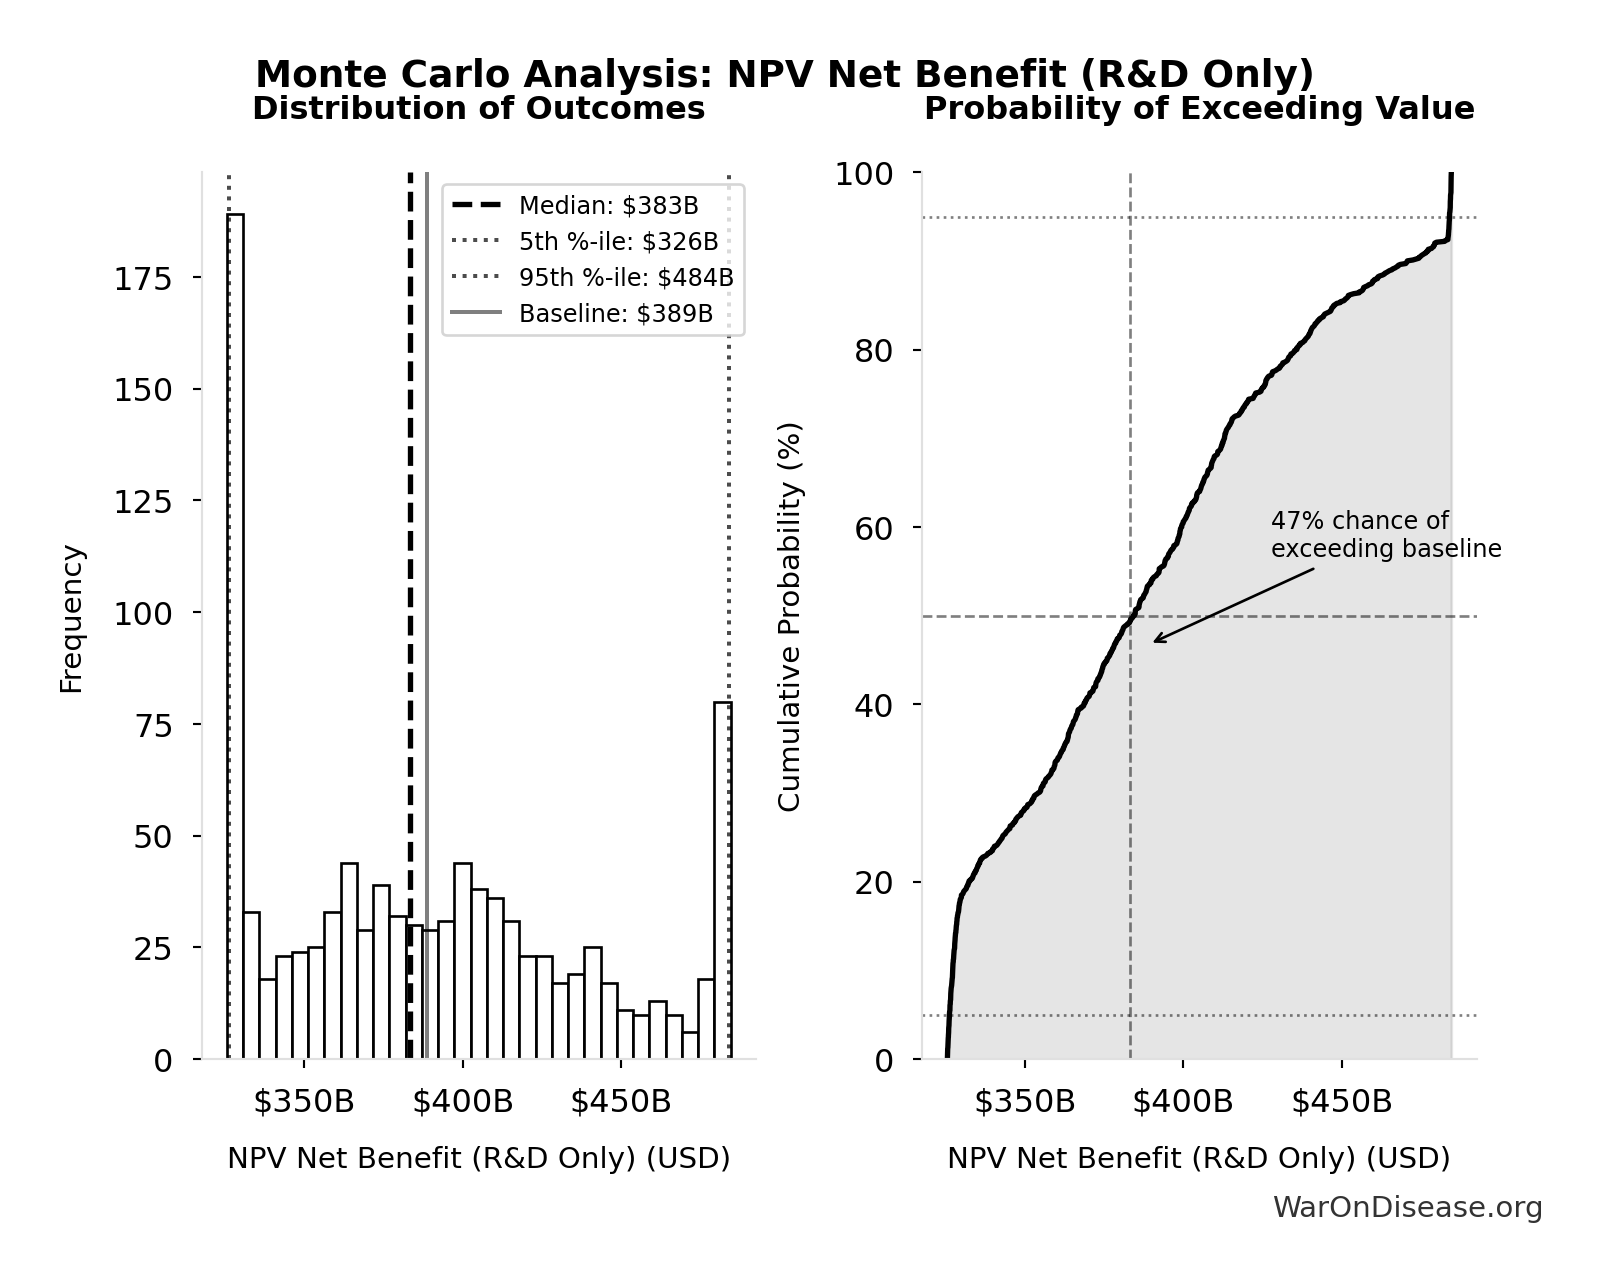
Simulation Results Summary: NPV Net Benefit (R&D Only)
| Statistic | Value |
|---|---|
| Baseline (deterministic) | $389B |
| Mean (expected value) | $390B |
| Median (50th percentile) | $383B |
| Standard Deviation | $50.7B |
| 90% Range (5th-95th percentile) | [$326B, $484B] |
The histogram shows the distribution of NPV Net Benefit (R&D Only) across 10,000 Monte Carlo simulations. The CDF (right) shows the probability of the outcome exceeding any given value, which is useful for risk assessment.
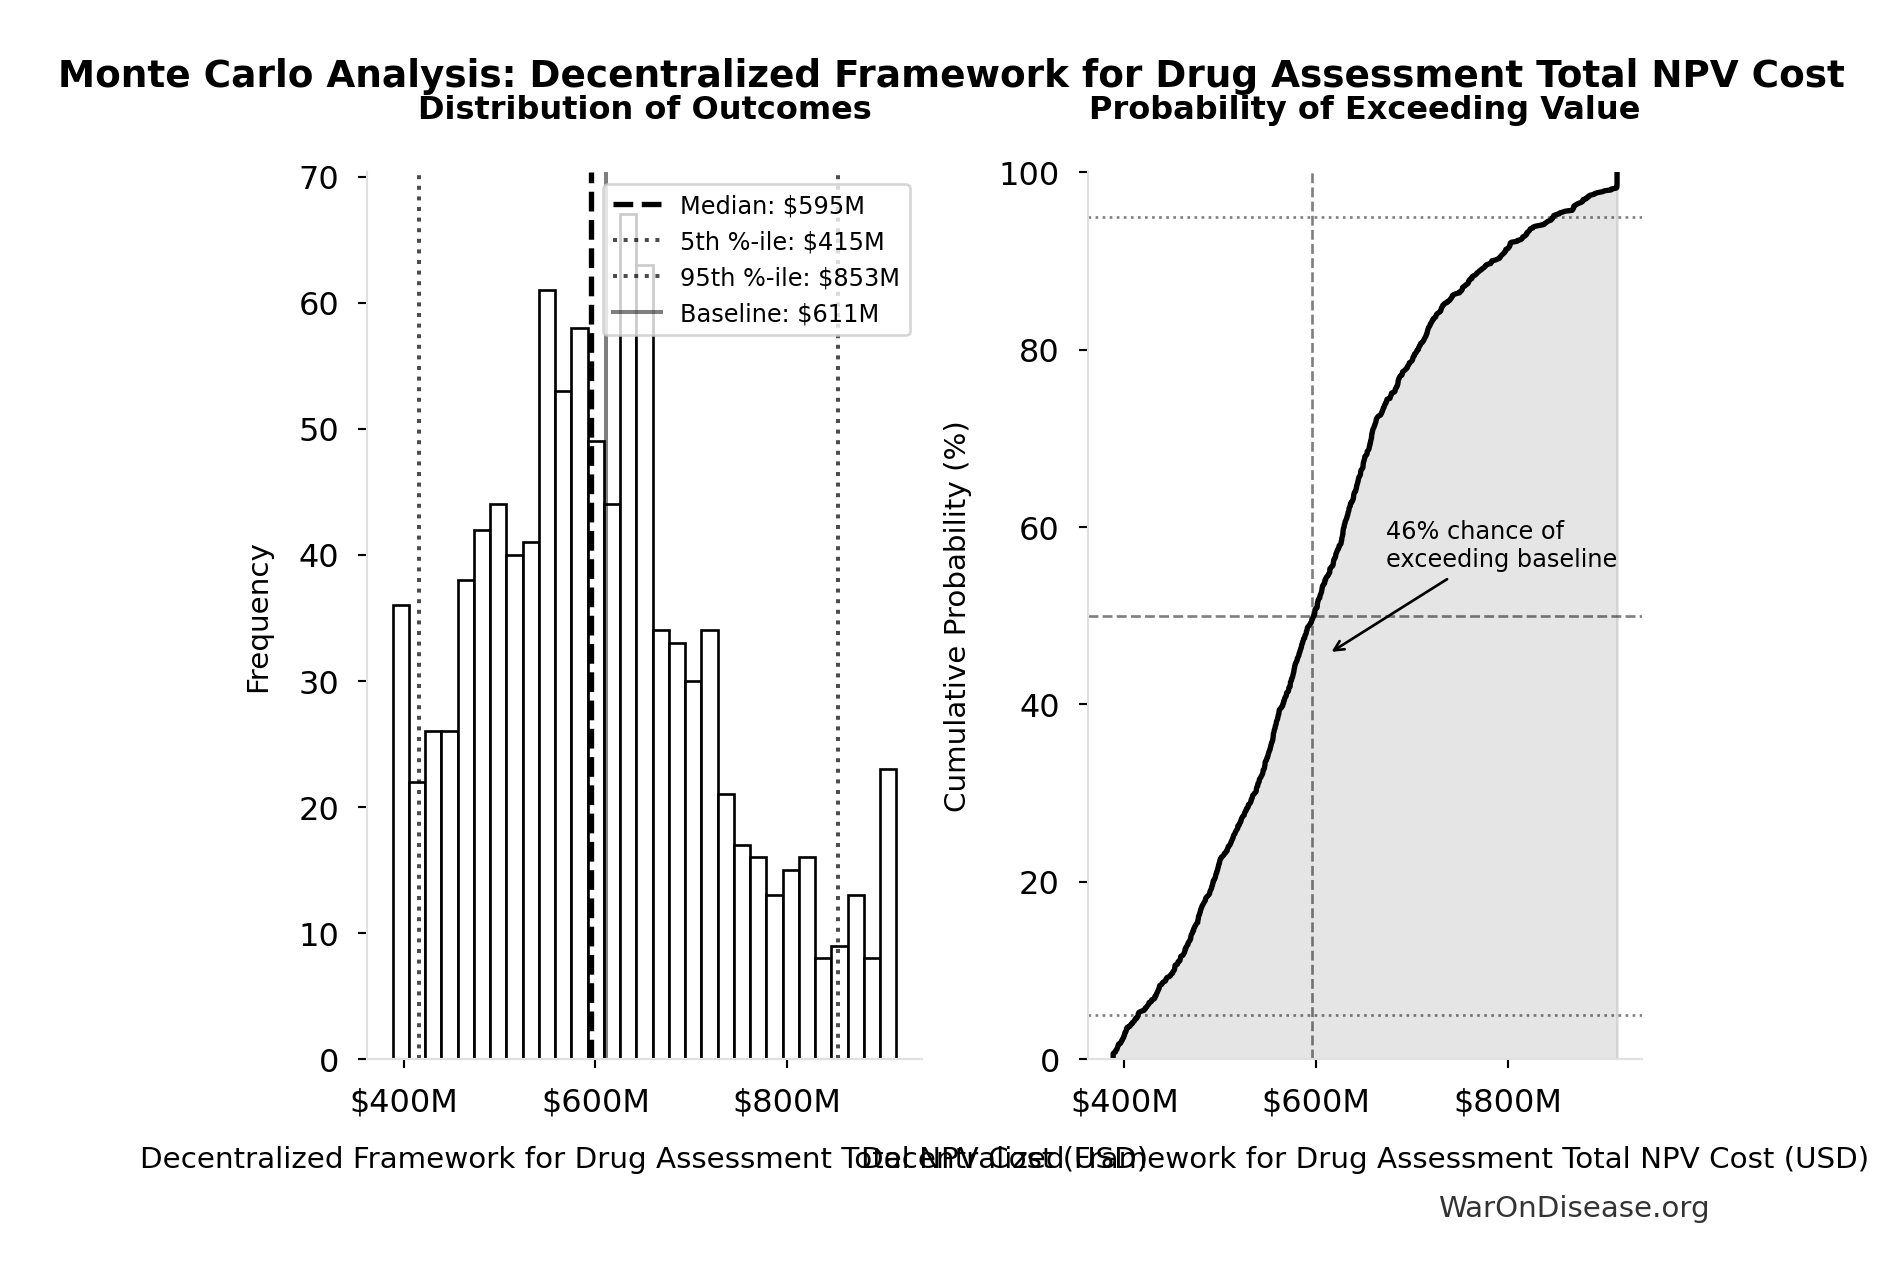
Simulation Results Summary: Decentralized Framework for Drug Assessment Total NPV Cost
| Statistic | Value |
|---|---|
| Baseline (deterministic) | $611M |
| Mean (expected value) | $609M |
| Median (50th percentile) | $595M |
| Standard Deviation | $127M |
| 90% Range (5th-95th percentile) | [$415M, $853M] |
The histogram shows the distribution of Decentralized Framework for Drug Assessment Total NPV Cost across 10,000 Monte Carlo simulations. The CDF (right) shows the probability of the outcome exceeding any given value, which is useful for risk assessment.
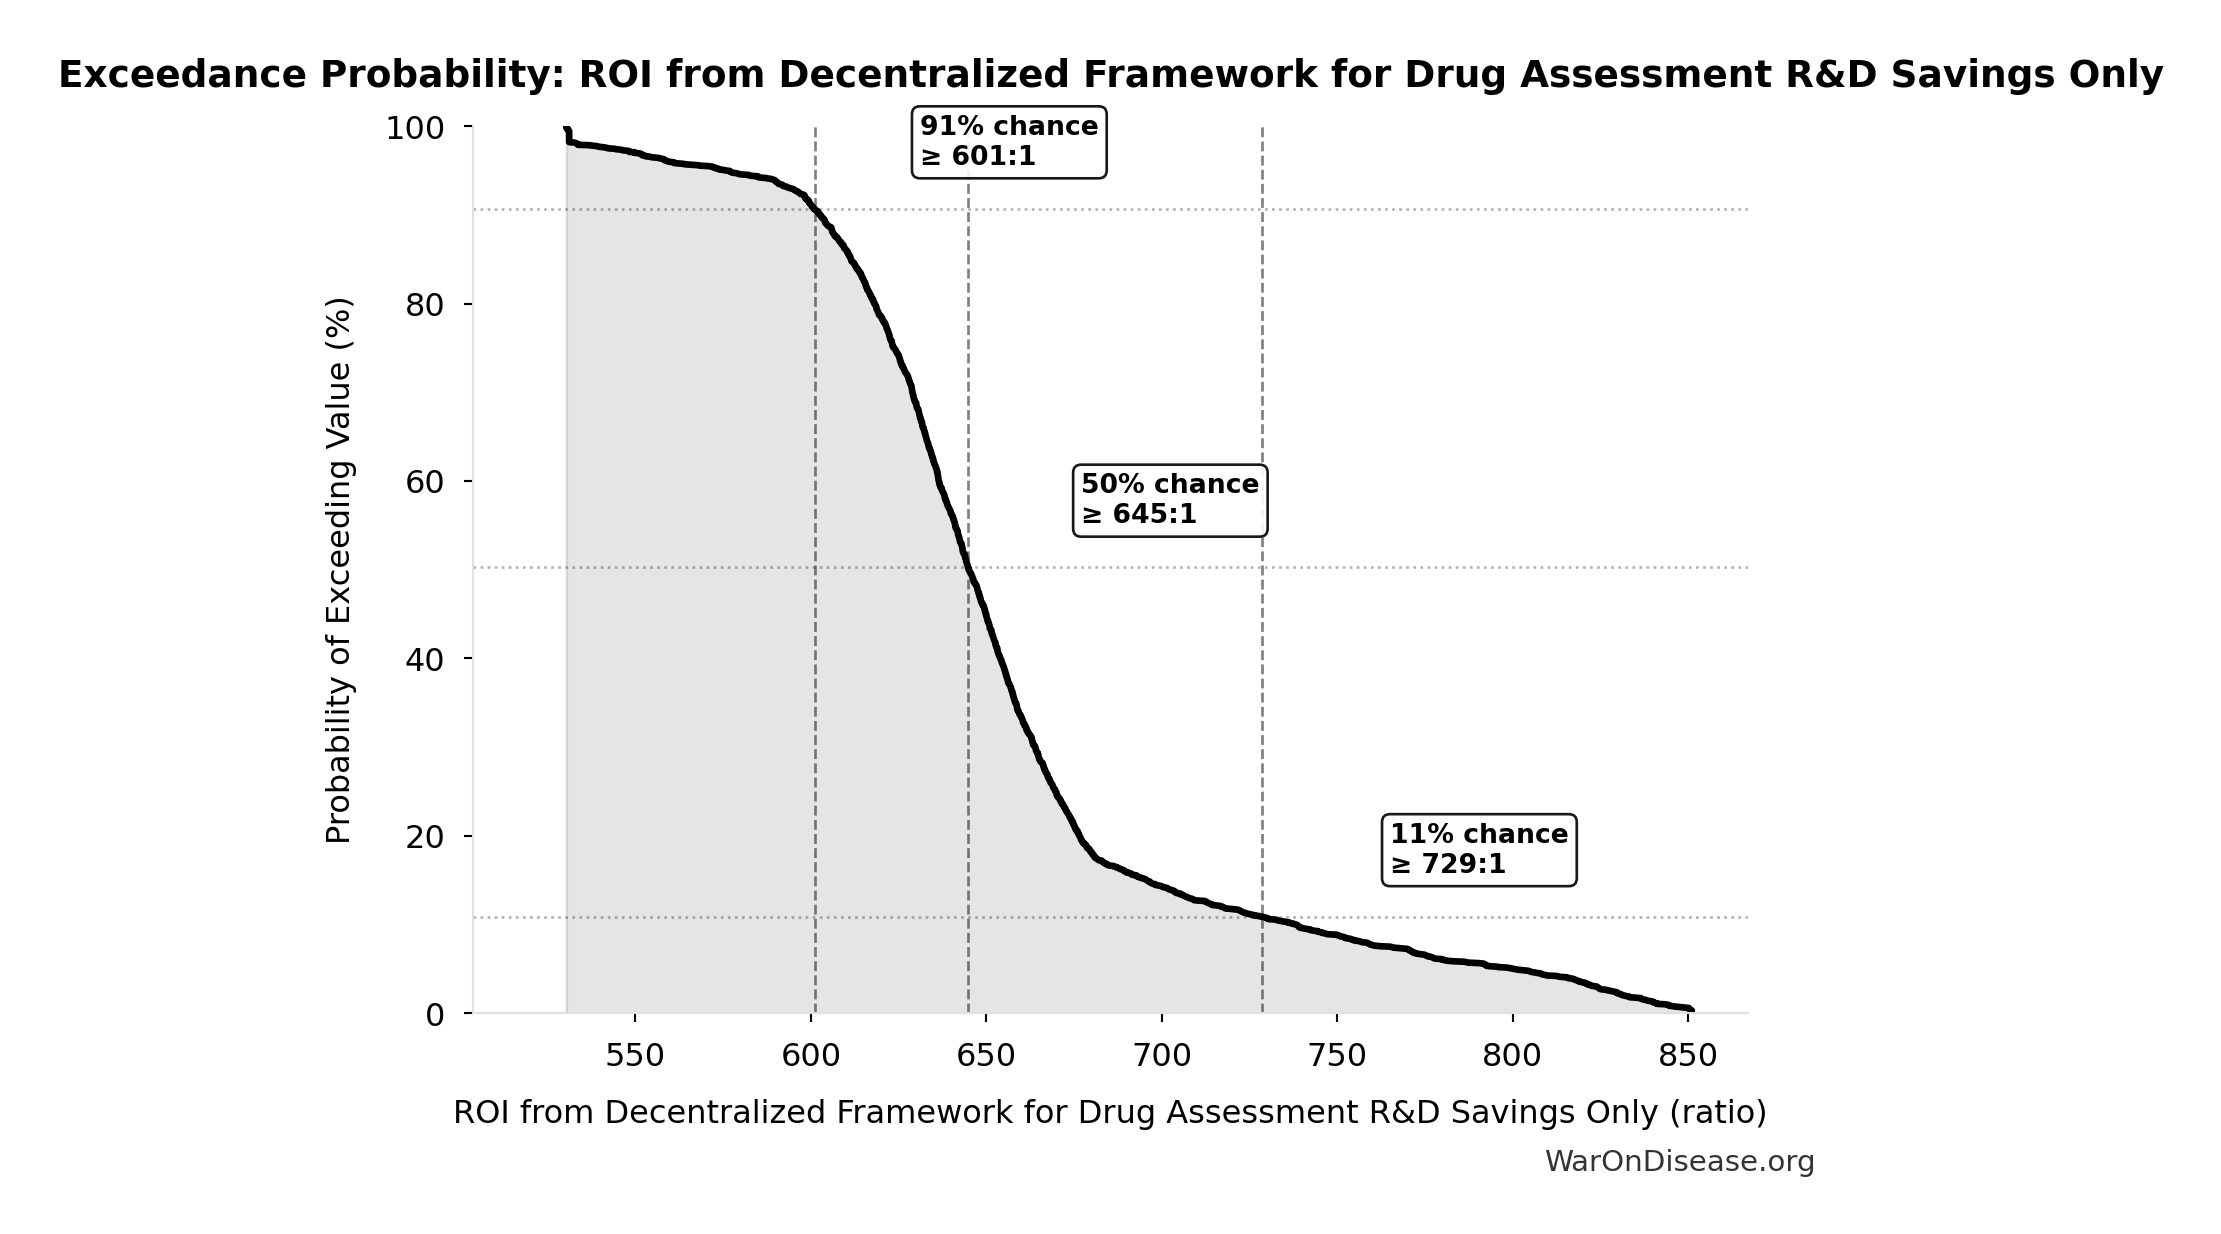
This exceedance probability chart shows the likelihood that ROI from Decentralized Framework for Drug Assessment R&D Savings Only will exceed any given threshold. Higher curves indicate more favorable outcomes with greater certainty.
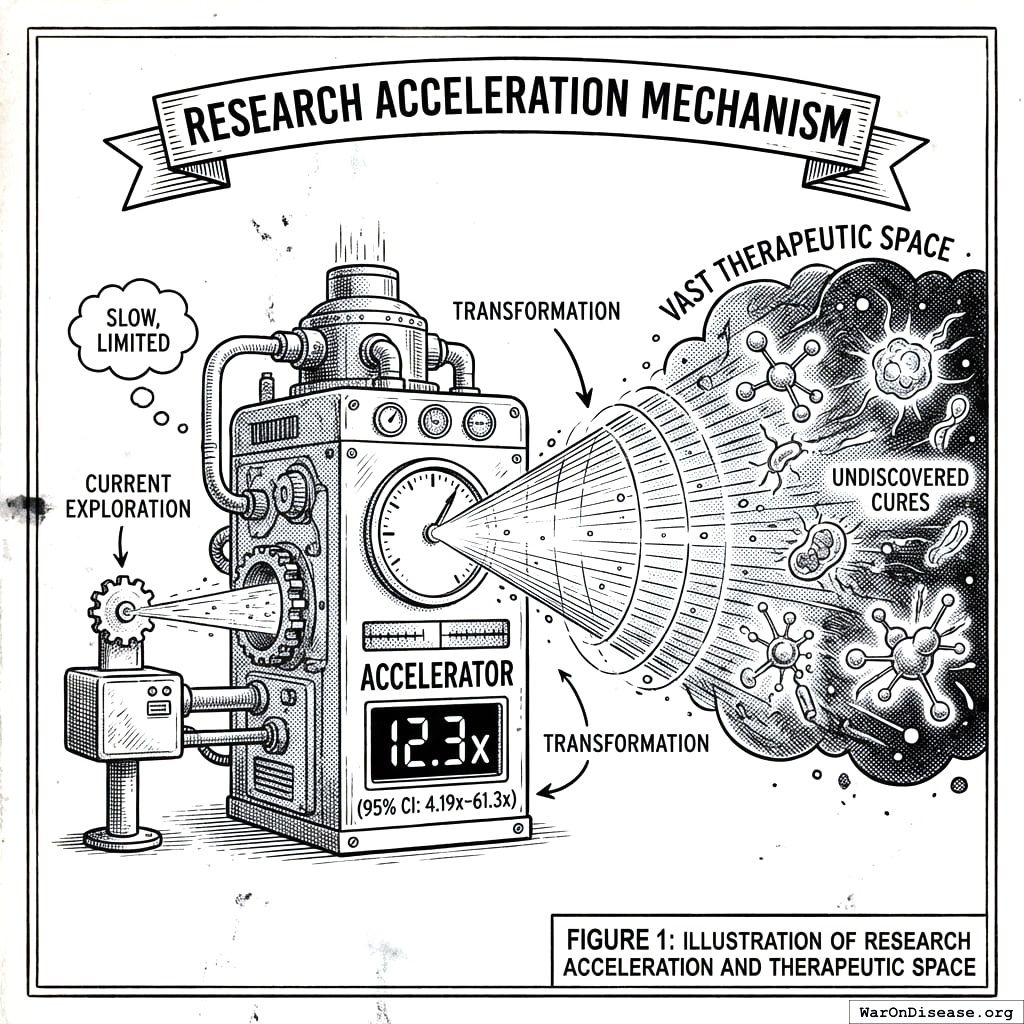
7 Research Acceleration Mechanism
The 12.3x (95% CI: 4.2x-61.4x) research acceleration transforms our ability to explore the vast therapeutic space where undiscovered cures already exist.
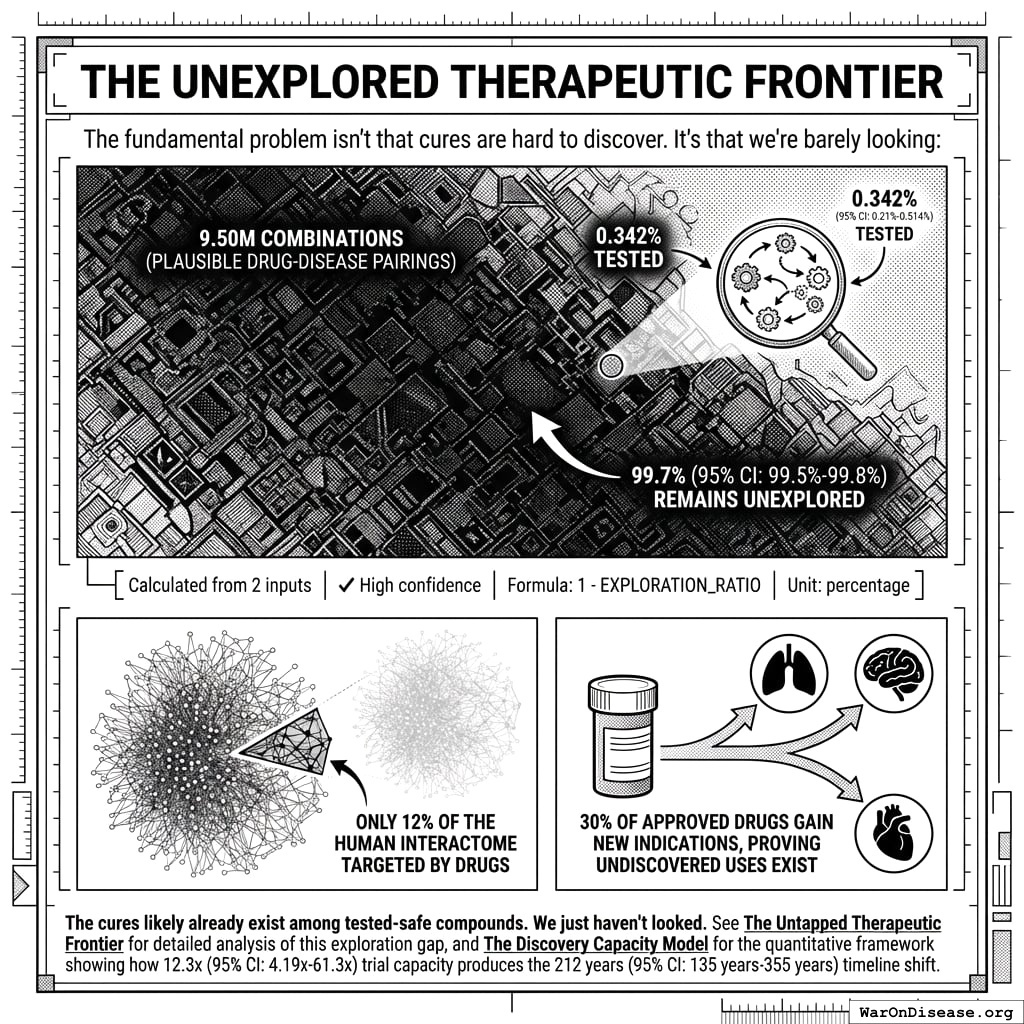
7.1 The Unexplored Therapeutic Frontier
The fundamental problem isn’t that cures are hard to discover. It’s that we’re barely looking:
- 9.5 million combinations plausible drug-disease pairings exist (9.5 thousand compounds (95% CI: 7 thousand compounds-12 thousand compounds) safe × 1 thousand diseases (95% CI: 800 diseases-1.2 thousand diseases))
- Only 0.342% (95% CI: 0%-1%) of these combinations have been tested - 99.7% (95% CI: 99%-100%) remains unexplored
- Only 12% of the human interactome has ever been targeted by drugs
- 30% of approved drugs gain new indications, proving undiscovered uses exist
\[
\begin{gathered}
Ratio_{explore} \\
= \frac{N_{tested}}{N_{combos}} \\
= \frac{32{,}500}{9.5M} \\
= 0.342\%
\end{gathered}
\]
where:
\[
\begin{gathered}
N_{combos} \\
= N_{safe} \times N_{diseases,trial} \\
= 9{,}500 \times 1{,}000 \\
= 9.5M
\end{gathered}
\]
The cures likely already exist among tested-safe compounds. We just haven’t looked. See The Untapped Therapeutic Frontier for detailed analysis of this exploration gap, and The Discovery Capacity Model for the quantitative framework showing how 12.3x (95% CI: 4.2x-61.4x) trial capacity produces the 212 years (95% CI: 135 years-355 years) timeline shift.
7.2 Addressing the Returns Question: Diminishing, Linear, or Compounding?
A common objection is that “more trials won’t produce proportionally more cures” - the diminishing returns hypothesis. This deserves serious consideration, but the evidence suggests the opposite may be true.
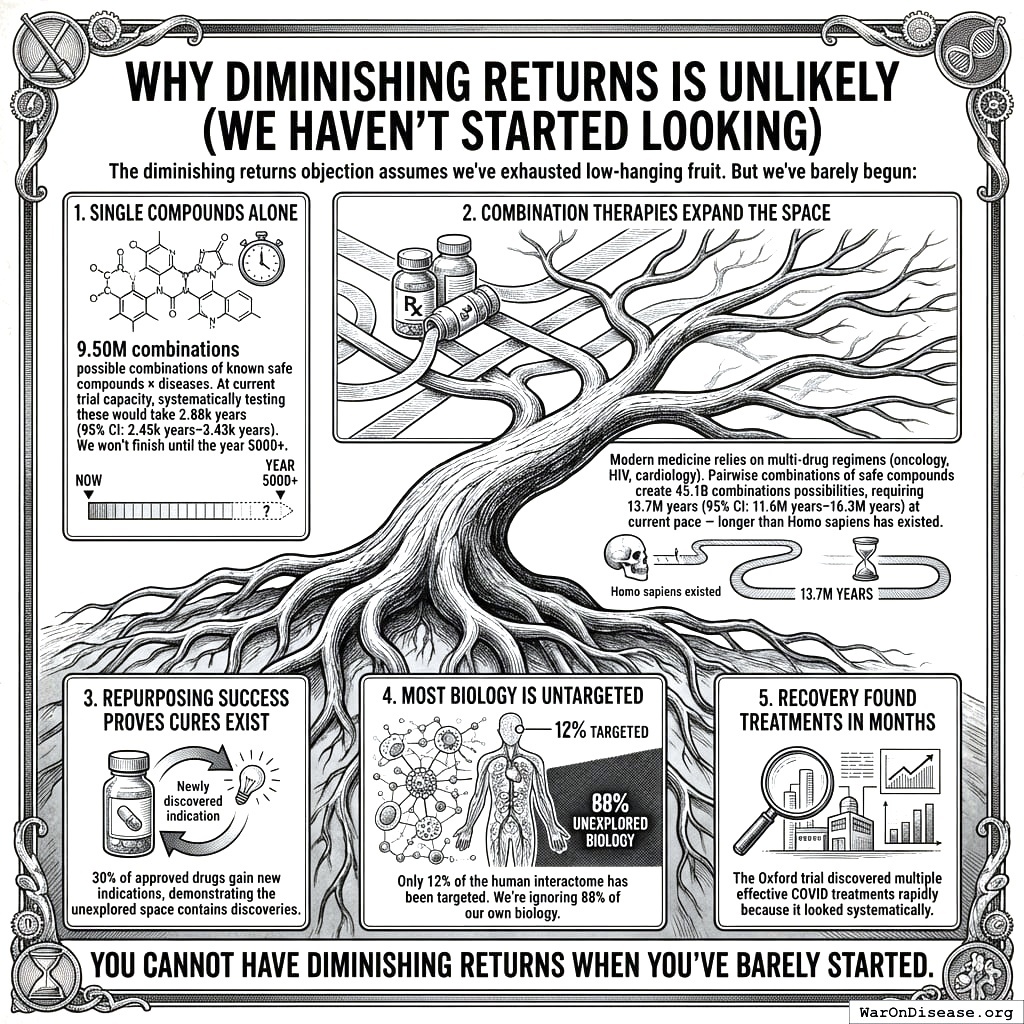
7.2.1 Why Diminishing Returns Is Unlikely (We Haven’t Started Looking)
The diminishing returns objection assumes we’ve exhausted low-hanging fruit. But we’ve barely begun:
- Single compounds alone: 9.5 million combinations possible combinations of known safe compounds × diseases. At current trial capacity, systematically testing these would take 2.88 thousand years (95% CI: 2.45 thousand years-3.43 thousand years). We won’t finish until the year 5000+.
\[
\begin{gathered}
T_{explore,safe} \\
= \frac{N_{combos}}{Trials_{ann,curr}} \\
= \frac{9.5M}{3{,}300} \\
= 2{,}880
\end{gathered}
\]
where:
\[
\begin{gathered}
N_{combos} \\
= N_{safe} \times N_{diseases,trial} \\
= 9{,}500 \times 1{,}000 \\
= 9.5M
\end{gathered}
\]
Combination therapies expand the space: Modern medicine relies on multi-drug regimens (oncology, HIV, cardiology). Pairwise combinations of safe compounds create 45.1 billion combinations possibilities, requiring 13.7 million years (95% CI: 11.6 million years-16.3 million years) at current pace - longer than Homo sapiens has existed.
Repurposing success proves cures exist: 30% of approved drugs gain new indications, demonstrating the unexplored space contains discoveries.
Most biology is untargeted: Only 12% of the human interactome has been targeted. We’re ignoring 88% of our own biology.
RECOVERY found treatments in months: The Oxford trial discovered multiple effective COVID treatments rapidly because it looked systematically.
You cannot have diminishing returns when you’ve barely started.
7.2.2 Mathematical Framework: When Would Diminishing Returns Dominate?
We can formalize the competing models to identify when diminishing returns would actually matter.
Model 1: Linear (Baseline)
\[ T_{discovered} = k_0 \cdot N_{trials} \]
Where \(k_0\) is the constant discovery rate (effective treatments per trial). This assumes the therapeutic space is sampled uniformly at random.
Model 2: Diminishing Returns (Pessimistic)
As we exhaust the therapeutic space, the hit rate decreases:
\[ k_{dim}(s) = k_0 \cdot (1 - s) \]
Where \(s = S_{explored}/S_{total}\) is the fraction of therapeutic space already tested. At current exploration (\(s < 0.01\)), this gives \(k_{dim} \approx 0.99 \cdot k_0\), virtually identical to linear.
Model 3: Learning/Compounding (Optimistic)
Each trial improves our biological models, increasing future hit rates:
\[ k_{learn}(n) = k_0 \cdot \left(1 + \alpha \cdot \ln(1 + n)\right) \]
Where \(\alpha\) is the learning coefficient and \(n\) is cumulative trials completed. Even modest learning (\(\alpha = 0.1\)) with 100,000 trials yields \(k_{learn} \approx 2.15 \cdot k_0\).
Model 4: Combined (Realistic)
Both effects operate simultaneously:
\[ k_{combined}(s, n) = k_0 \cdot (1 - s) \cdot \left(1 + \alpha \cdot \ln(1 + n)\right) \]
The Crossover Point: When Does Depletion Dominate Learning?
Diminishing returns dominates when the depletion factor exceeds the learning factor. Solving for the critical exploration fraction:
\[ s_{crossover} = 1 - \frac{1}{1 + \alpha \cdot \ln(1 + n)} \]
| Learning Coefficient (\(\alpha\)) | Trials Completed (\(n\)) | Crossover Exploration (\(s_{crossover}\)) |
|---|---|---|
| 0.05 (weak) | 100,000 | 37% |
| 0.10 (modest) | 100,000 | 53% |
| 0.15 (strong) | 100,000 | 63% |
Interpretation: Even with weak learning effects, diminishing returns only dominates after exploring 37%+ of therapeutic space. With modest learning, the crossover occurs at 53%+ exploration.
Timeline to Crossover:
At current exploration of 0.342% (95% CI: 0%-1%) (<1%), reaching the 53% crossover would require ~1,500 years at current pace or ~125 years with the framework. For combination therapies (45.1 billion combinations), reaching 53% exploration would take millions of years.
Conclusion: For any plausible planning horizon, learning effects dominate. Diminishing returns is a theoretical concern for civilizations operating on multi-century timescales, not a practical constraint for the next 100+ years of medical research.
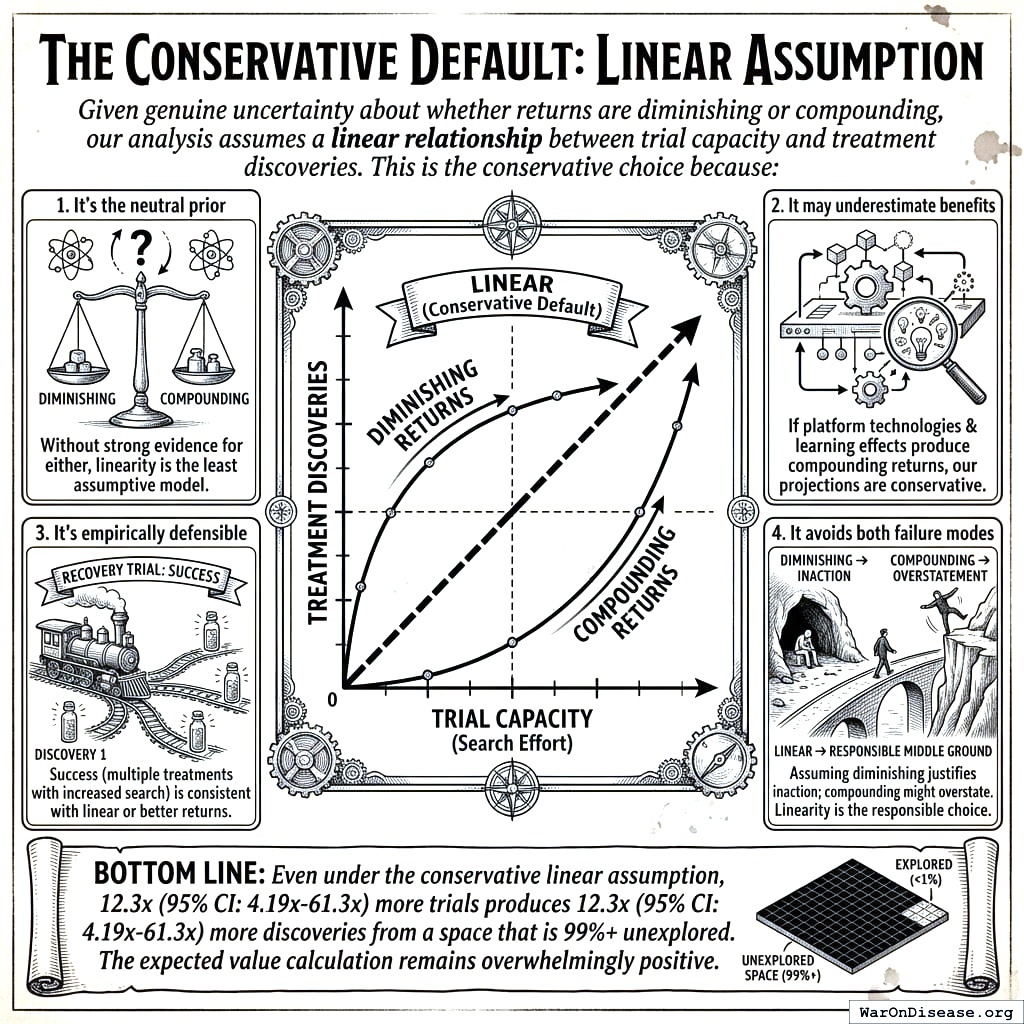
7.2.3 The Conservative Default: Linear Assumption
Given genuine uncertainty about whether returns are diminishing or compounding, our analysis assumes a linear relationship between trial capacity and treatment discoveries. This is the conservative choice because:
- It’s the neutral prior: Without strong evidence for either diminishing or compounding returns, linearity is the least assumptive model
- It may underestimate benefits: If platform technologies and learning effects produce compounding returns, our projections are conservative
- It’s empirically defensible: The RECOVERY trial’s success (multiple treatments found with increased search) is consistent with linear or better returns
- It avoids both failure modes: Assuming diminishing returns would justify inaction; assuming compounding returns might overstate benefits. Linearity is the responsible middle ground
Bottom line: Even under the conservative linear assumption, 12.3x (95% CI: 4.2x-61.4x) more trials produces 12.3x (95% CI: 4.2x-61.4x) more discoveries from a space that is 99%+ unexplored. The expected value calculation remains overwhelmingly positive.
7.2.4 Funding Level vs. Cost-Effectiveness
While the analysis above addresses whether trials produce proportionally more cures, a separate question is how funding level affects cost per DALY averted. The acceleration formula \(T_{accel} = T_{baseline} \times (1 - 1/k)\), where \(k\) is the trial capacity multiplier, produces natural diminishing returns: each additional dollar buys less acceleration as \(k\) grows. Figure 1 shows cost per DALY rising with funding, while Figure 2 shows total DALYs approaching an asymptotic ceiling.
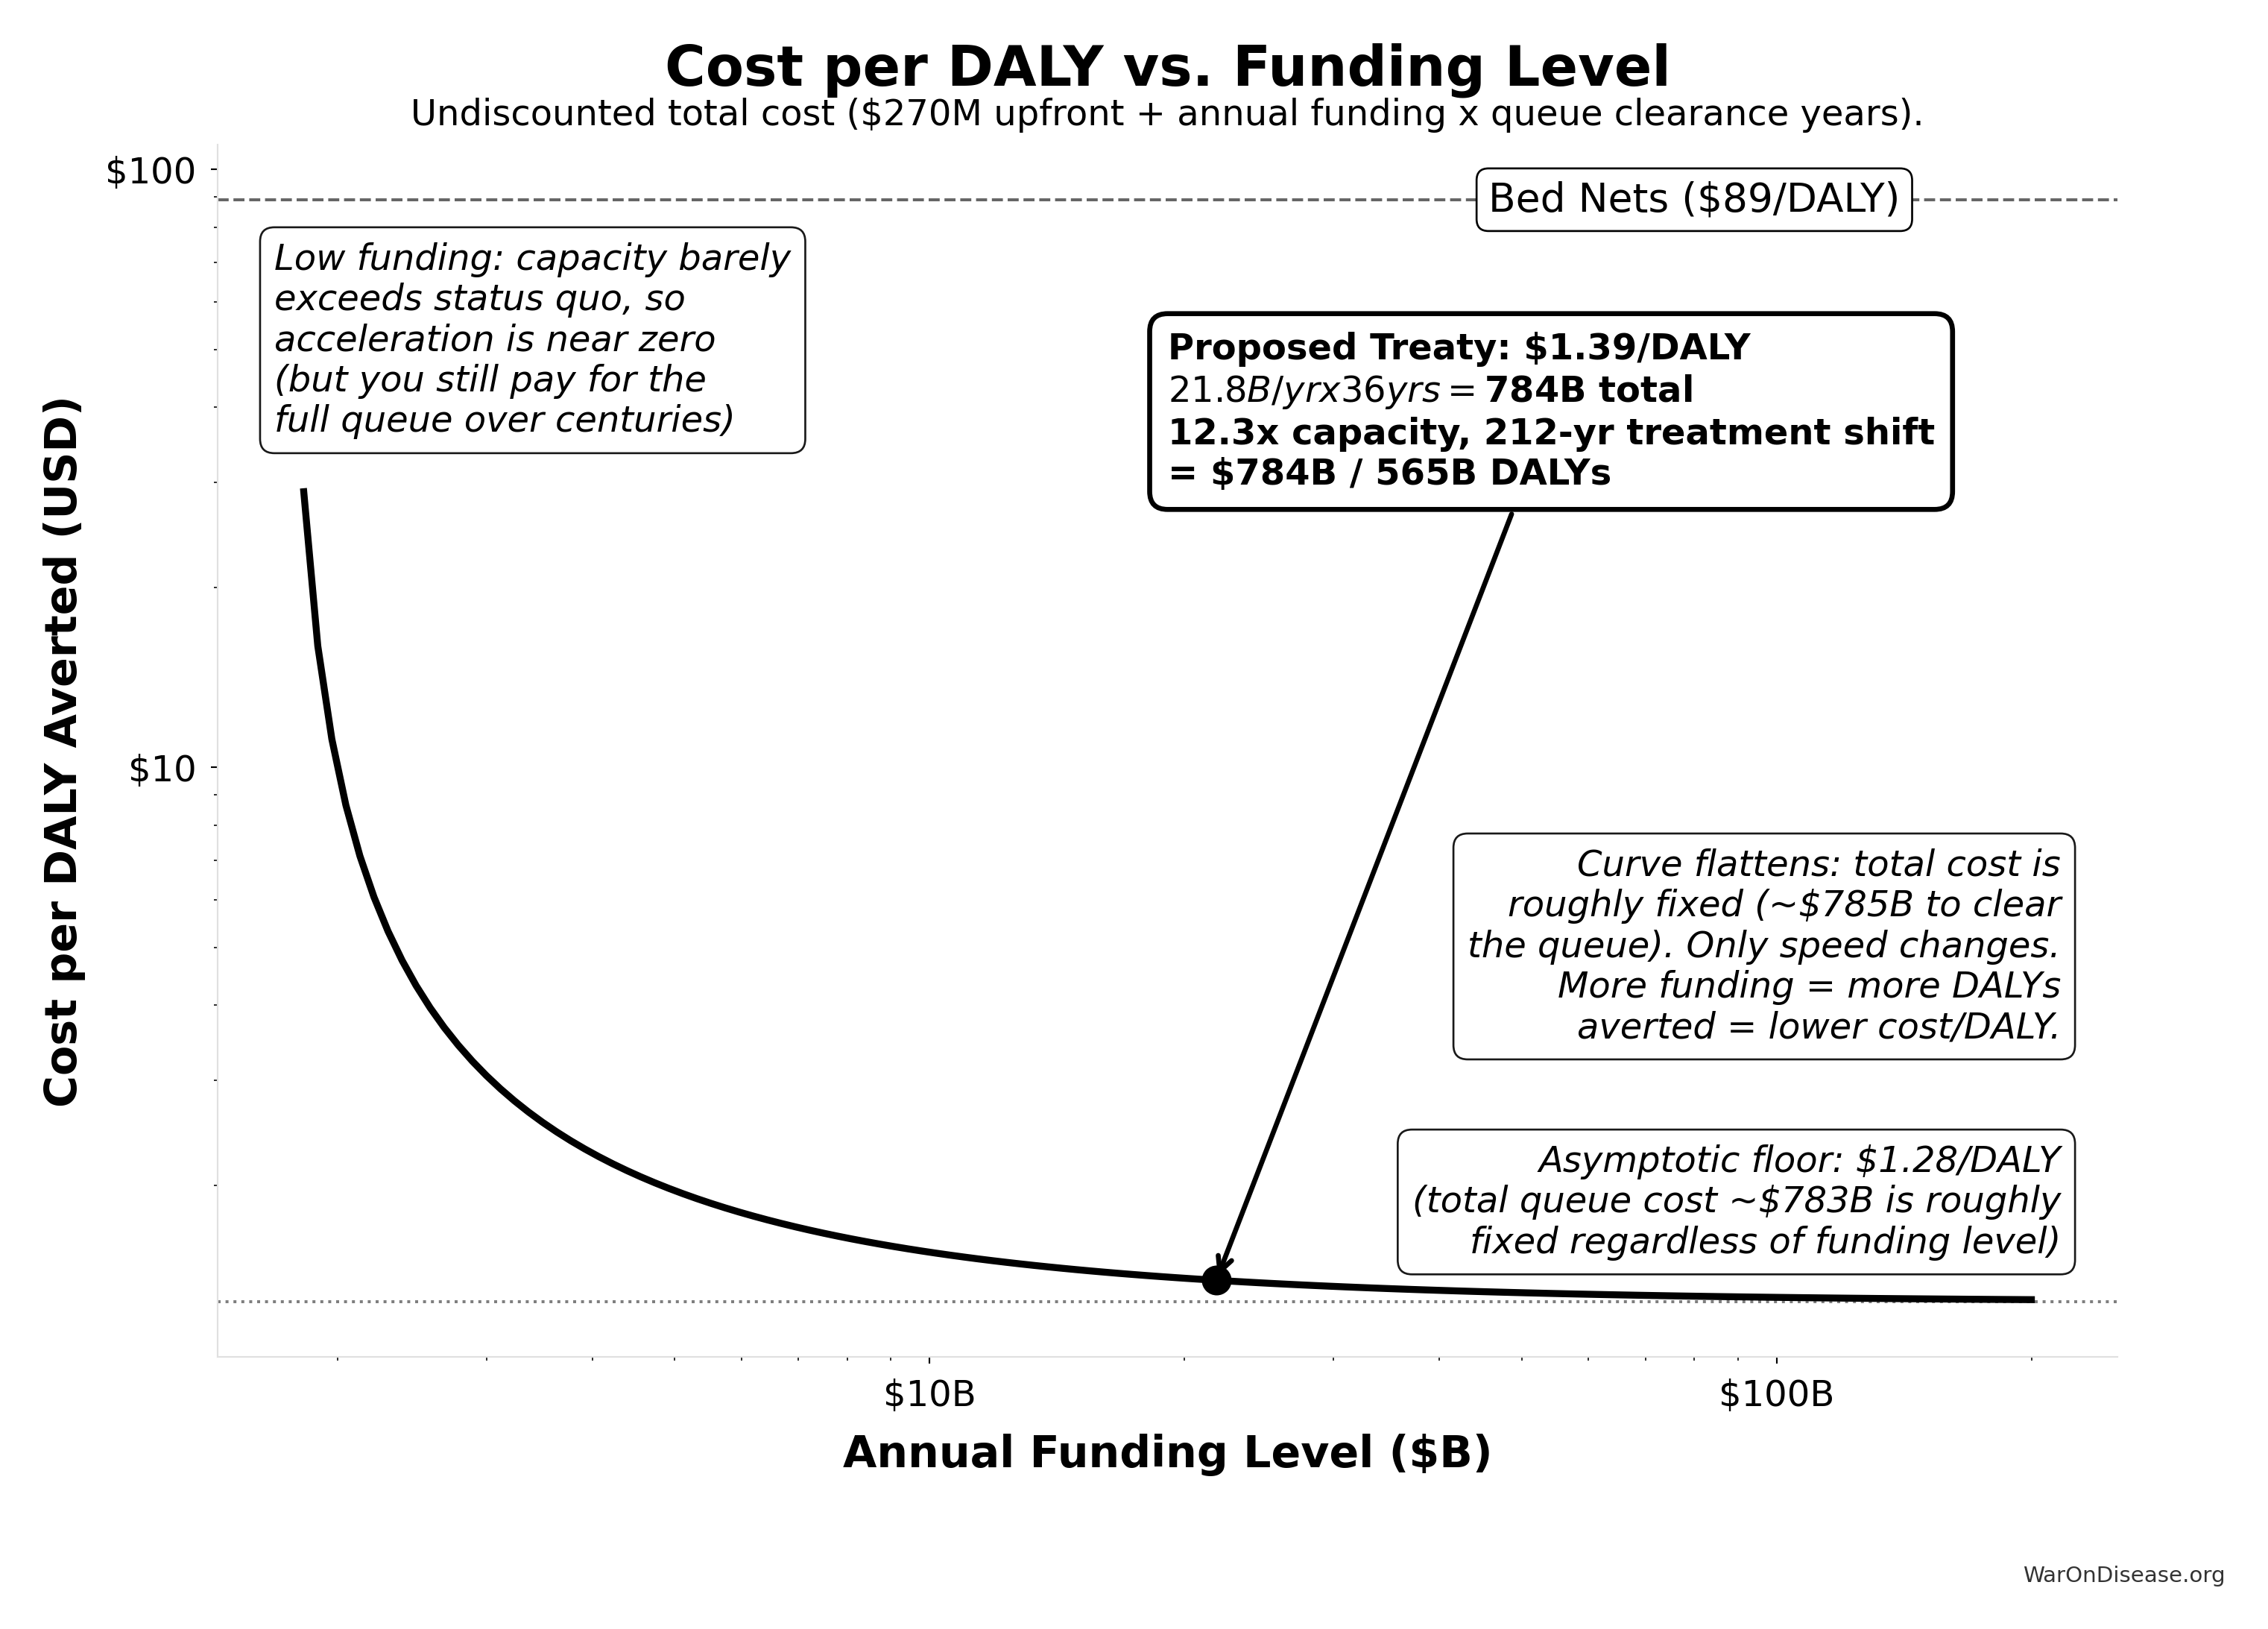
Verification at proposed funding ($21.8B/yr):
  Trial capacity multiplier: 12.3x
  Queue clearance: 36.0 years
  Treatment acceleration: 203.7 years
  Total timeline shift: 211.9 years
  DALYs averted: 565.2B
  Upfront cost: $270M
  Total undiscounted cost: $784.2B
  Cost per DALY: $1.39
  Asymptotic floor: $1.28/DALY (total queue cost: $783B)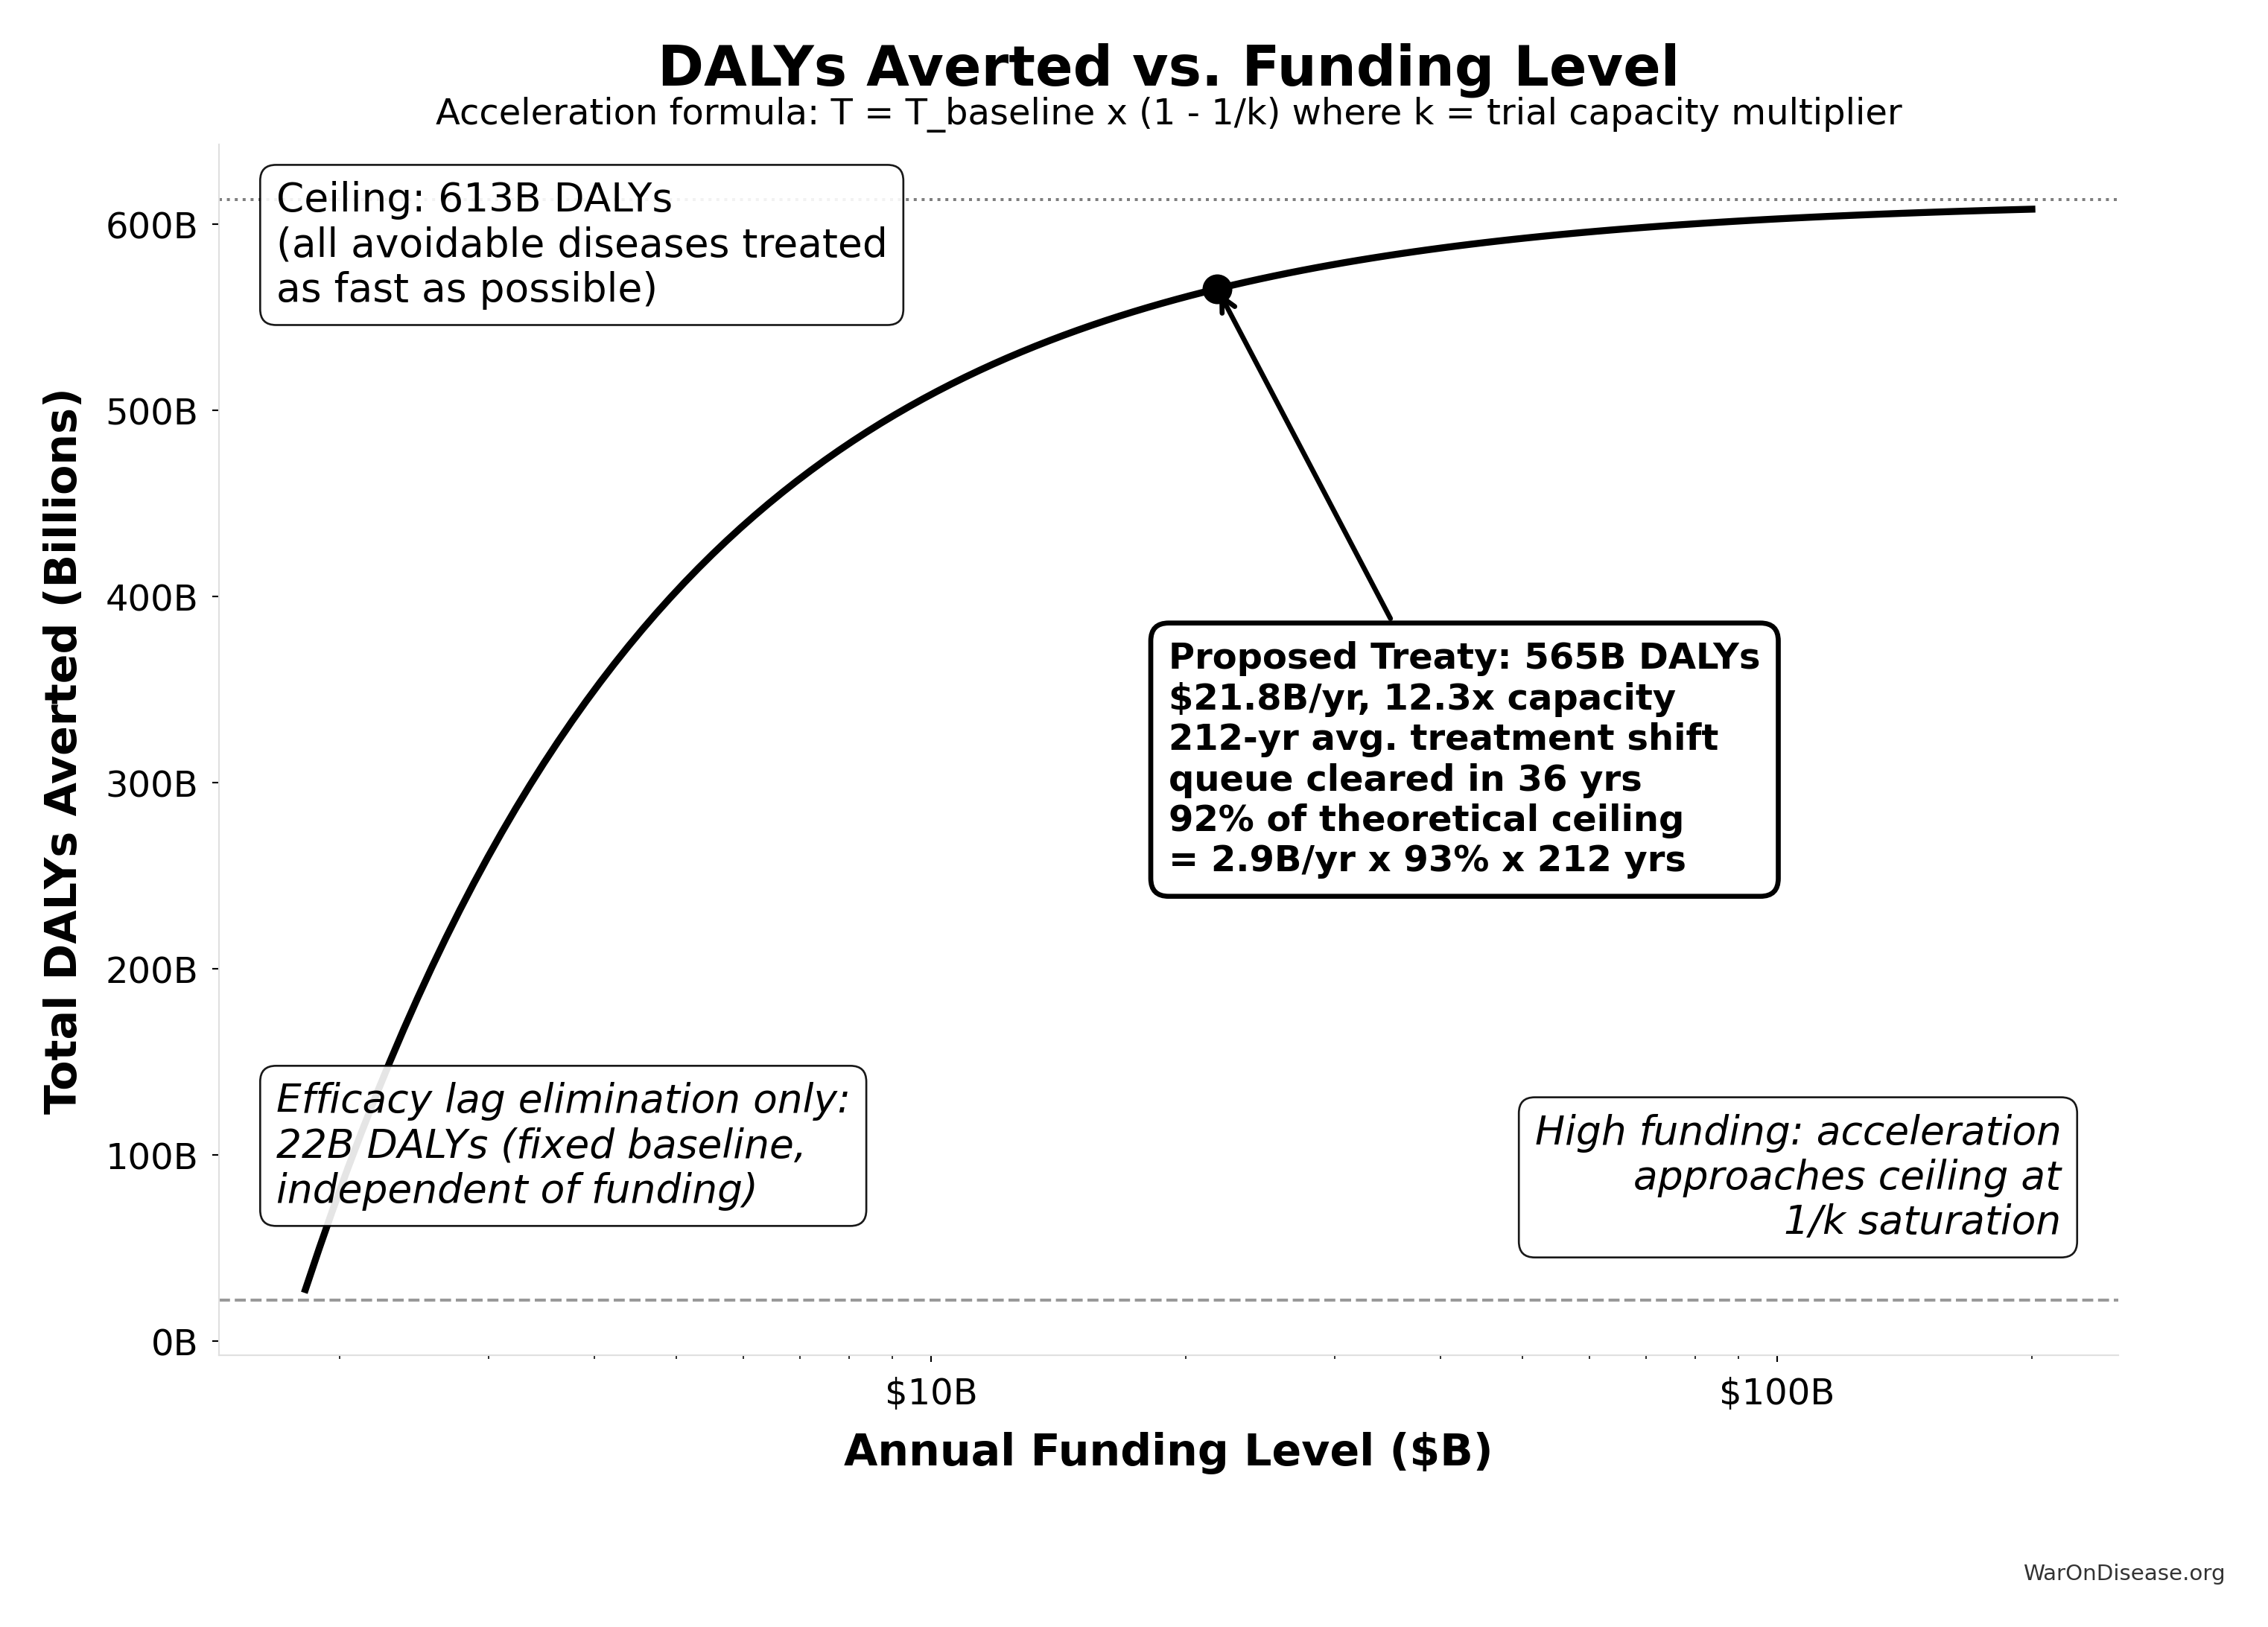
Verification at proposed funding ($21.8B/yr):
  Trial capacity multiplier: 12.3x
  Queue clearance: 36.0 years
  Treatment acceleration: 203.7 years
  Total timeline shift: 211.9 years
  DALYs averted: 565B
  Ceiling DALYs: 613B
  Utilization: 92.2% of ceiling
  Efficacy lag baseline: 22B DALYs
The proposed funding level ($21.8B/year) sits in the steep part of the curve, where cost-effectiveness is strongest. Even at much higher funding levels, the cost per DALY remains far below the bed nets benchmark ($89 (95% CI: $78-$100)/DALY).
8 Data Sources and Methodological Notes
Cost of Current Drug Development:
- Tufts Center for the Study of Drug Development often cited for $1.0 - $2.6 billion/drug.
- Journal articles and industry reports (IQVIA, Deloitte) also highlight $2+ billion figures.
- Oxford RECOVERY trial: $500 (95% CI: $400-$2.5K)/patient (exceptional NHS/COVID conditions). ADAPTABLE trial: $929 (95% CI: $929-$1.4K)/patient (typical US pragmatic trial). Our projections use $929 (95% CI: $97-$3K)/patient based on ADAPTABLE; confidence interval captures uncertainty.
ROI Calculation Method:
- Simplified approach comparing aggregated R&D spending to potential savings.
- Does not account for intangible factors (opportunity costs, IP complexities, time-value of money) beyond a basic Net Present Value (NPV) perspective.
Scale & Adoption Rates:
- The largest uncertainties revolve around uptake speed, regulatory harmonization, and participant willingness.
- Projections assume widespread adoption by major pharmaceutical companies and global health authorities.
Secondary Benefits:
- Quality-of-life improvements, lower healthcare costs from faster drug innovation, and potentially fewer adverse events from earlier detection.
- These are positive externalities that can significantly enlarge real ROI from a societal perspective.
9 Conclusion
A decentralized FDA transforms the centralized regulatory approach into a global, decentralized model, reducing clinical trial costs by a factor of 44.1x (95% CI: 39.4x-89.1x), accelerating approval timelines, and expanding therapeutic coverage to neglected diseases. The 10-year NPV total cost is $611M (95% CI: $415M-$853M) (upfront plus discounted annual operations), generating $389B (95% CI: $326B-$484B) in net R&D savings. Given that the pharmaceutical industry collectively spends $60B (95% CI: $50B-$75B) annually on clinical trials, a 97.7% (95% CI: 97%-99%) reduction yields an ROI of 637 (95% CI: 569-790):1 at scale.
Beyond direct savings, the effects on medical progress are substantial: expanded therapeutic exploration, real-time treatment effectiveness rankings, and research on off-patent treatments that currently lack commercial incentives. With appropriate privacy protections and international coordination, this framework enables evidence-based personalized medicine at global scale.
9.1 Disclaimer
All figures in this document are estimates based on publicly available information, industry benchmarks, and simplifying assumptions. Real-world costs, savings, and ROI will vary greatly depending on the scope of implementation, the speed of adoption, regulatory cooperation, and numerous other factors. Nonetheless, this high-level exercise illustrates the substantial potential gains from a global, decentralized, continuously learning clinical trial and regulatory ecosystem.
10 Verification: Complete Derivation Chains
For economist verification, this section provides complete derivation chains for all headline figures. Each metric traces back to primary data sources.
10.1 Trial Capacity Multiplier Derivation
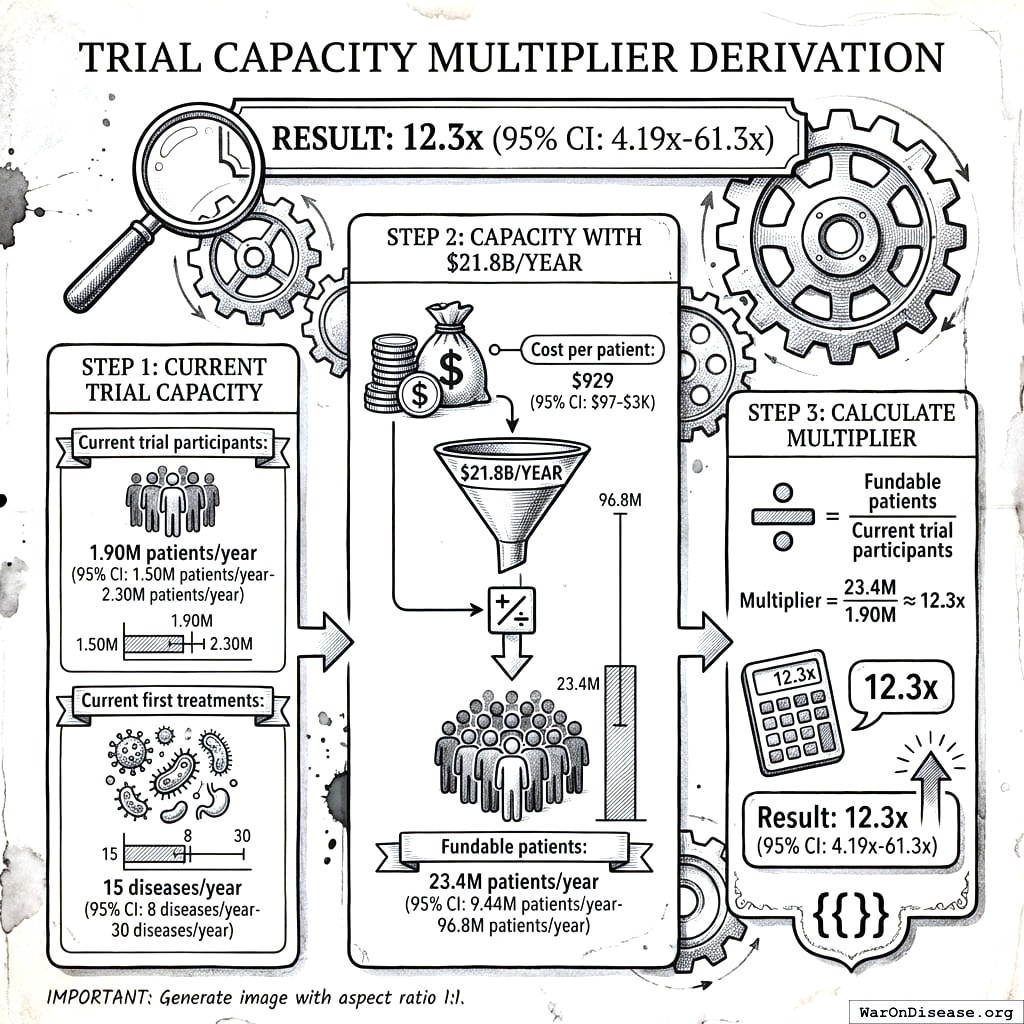
Result: 12.3x (95% CI: 4.2x-61.4x)
Step 1: Current trial capacity
- Current trial participants: 1.9 million patients/year (95% CI: 1.5 million patients/year-2.3 million patients/year)
- Current first treatments: 15 diseases/year (95% CI: 8 diseases/year-30 diseases/year)
Step 2: Capacity with $21.8B/year
- Cost per patient: $929 (95% CI: $97-$3K)
- Fundable patients: 23.4 million patients/year (95% CI: 9.46 million patients/year-97 million patients/year)
Step 3: Calculate multiplier
\[
\begin{gathered}
k_{capacity} \\
= \frac{N_{fundable,dFDA}}{Slots_{curr}} \\
= \frac{23.4M}{1.9M} \\
= 12.3
\end{gathered}
\]
where:
\[
\begin{gathered}
N_{fundable,dFDA} \\
= \frac{Subsidies_{dFDA,ann}}{Cost_{pragmatic,pt}} \\
= \frac{\$21.8B}{\$929} \\
= 23.4M
\end{gathered}
\]
where:
\[
\begin{gathered}
Subsidies_{dFDA,ann} \\
= Funding_{dFDA,ann} - OPEX_{dFDA} \\
= \$21.8B - \$40M \\
= \$21.8B
\end{gathered}
\]
where:
\[
\begin{gathered}
OPEX_{dFDA} \\
= Cost_{platform} + Cost_{staff} + Cost_{infra} \\
+ Cost_{regulatory} + Cost_{community} \\
= \$15M + \$10M + \$8M + \$5M + \$2M \\
= \$40M
\end{gathered}
\]
10.2 Timeline Shift Derivation
Result: 212 years (95% CI: 135 years-355 years)
Components:
| Component | Value | Source |
|---|---|---|
| Efficacy Lag Elimination | FDA drug approval timeline data | |
| Discovery Acceleration | Capacity vs. backlog model | |
| Combined Total | 212 years (95% CI: 135 years-355 years) | Sum of components |
\[
T_{accel,max} = T_{accel} + T_{lag} = 204 + 8.2 = 212
\]
where:
\[
\begin{gathered}
T_{accel} \\
= T_{first,SQ} \times \left(1 - \frac{1}{k_{capacity}}\right) \\
= 222 \times \left(1 - \frac{1}{12.3}\right) \\
= 204
\end{gathered}
\]
where:
\[
\begin{gathered}
T_{first,SQ} \\
= T_{queue,SQ} \times 0.5 \\
= 443 \times 0.5 \\
= 222
\end{gathered}
\]
where:
\[
\begin{gathered}
T_{queue,SQ} \\
= \frac{N_{untreated}}{Treatments_{new,ann}} \\
= \frac{6{,}650}{15} \\
= 443
\end{gathered}
\]
where:
\[
\begin{gathered}
N_{untreated} \\
= N_{rare} \times 0.95 \\
= 7{,}000 \times 0.95 \\
= 6{,}650
\end{gathered}
\]
where:
\[
\begin{gathered}
k_{capacity} \\
= \frac{N_{fundable,dFDA}}{Slots_{curr}} \\
= \frac{23.4M}{1.9M} \\
= 12.3
\end{gathered}
\]
where:
\[
\begin{gathered}
N_{fundable,dFDA} \\
= \frac{Subsidies_{dFDA,ann}}{Cost_{pragmatic,pt}} \\
= \frac{\$21.8B}{\$929} \\
= 23.4M
\end{gathered}
\]
where:
\[
\begin{gathered}
Subsidies_{dFDA,ann} \\
= Funding_{dFDA,ann} - OPEX_{dFDA} \\
= \$21.8B - \$40M \\
= \$21.8B
\end{gathered}
\]
where:
\[
\begin{gathered}
OPEX_{dFDA} \\
= Cost_{platform} + Cost_{staff} + Cost_{infra} \\
+ Cost_{regulatory} + Cost_{community} \\
= \$15M + \$10M + \$8M + \$5M + \$2M \\
= \$40M
\end{gathered}
\]
10.3 Lives Saved Derivation
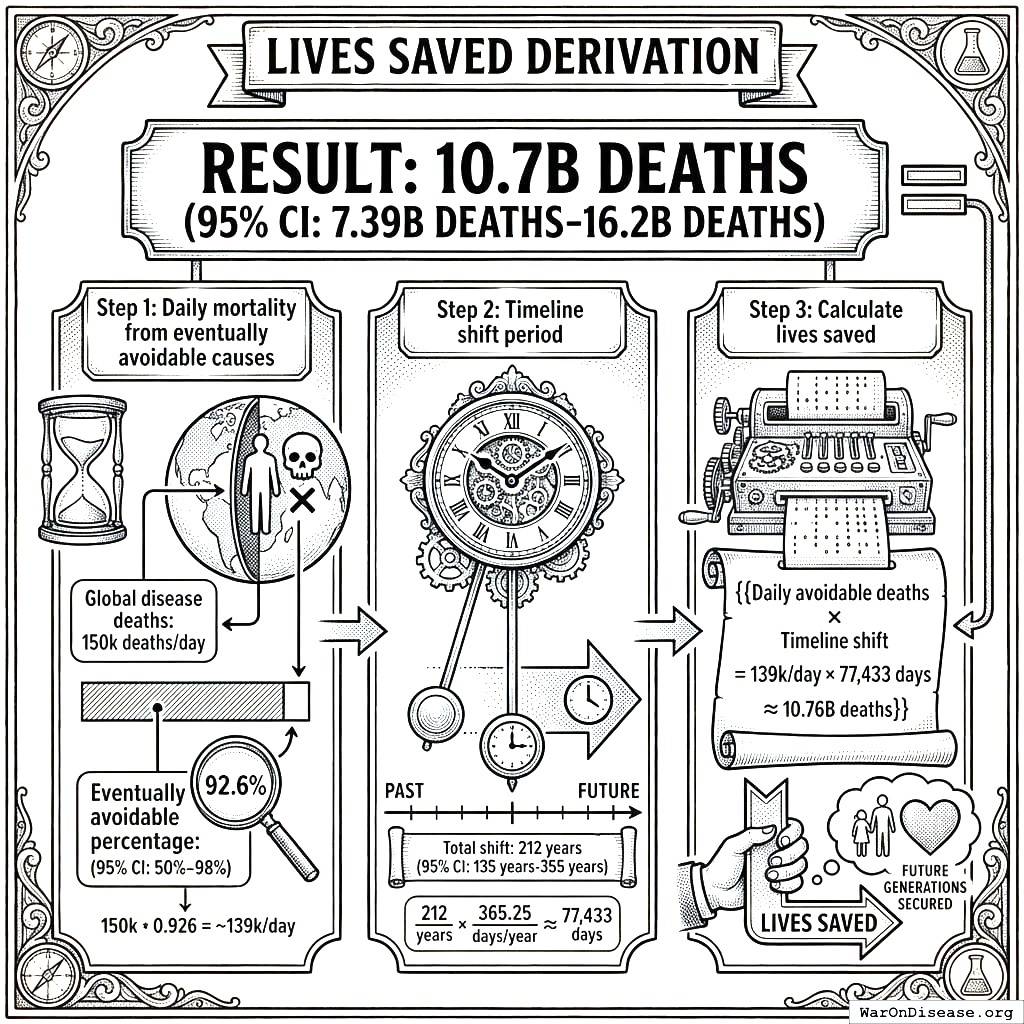
Result: 10.7 billion deaths (95% CI: 7.4 billion deaths-16.2 billion deaths)
Step 1: Daily mortality from eventually avoidable causes
- Global disease deaths: 150,000/day4
- Eventually avoidable percentage: 92.6% (95% CI: 50%-98%)
Step 2: Timeline shift period
- Total shift: 212 years (95% CI: 135 years-355 years)
Step 3: Calculate lives saved
\[
\begin{gathered}
Lives_{max} \\
= Deaths_{disease,daily} \times T_{accel,max} \times 338 \\
= 150{,}000 \times 212 \times 338 \\
= 10.7B
\end{gathered}
\]
where:
\[
T_{accel,max} = T_{accel} + T_{lag} = 204 + 8.2 = 212
\]
where:
\[
\begin{gathered}
T_{accel} \\
= T_{first,SQ} \times \left(1 - \frac{1}{k_{capacity}}\right) \\
= 222 \times \left(1 - \frac{1}{12.3}\right) \\
= 204
\end{gathered}
\]
where:
\[
\begin{gathered}
T_{first,SQ} \\
= T_{queue,SQ} \times 0.5 \\
= 443 \times 0.5 \\
= 222
\end{gathered}
\]
where:
\[
\begin{gathered}
T_{queue,SQ} \\
= \frac{N_{untreated}}{Treatments_{new,ann}} \\
= \frac{6{,}650}{15} \\
= 443
\end{gathered}
\]
where:
\[
\begin{gathered}
N_{untreated} \\
= N_{rare} \times 0.95 \\
= 7{,}000 \times 0.95 \\
= 6{,}650
\end{gathered}
\]
where:
\[
\begin{gathered}
k_{capacity} \\
= \frac{N_{fundable,dFDA}}{Slots_{curr}} \\
= \frac{23.4M}{1.9M} \\
= 12.3
\end{gathered}
\]
where:
\[
\begin{gathered}
N_{fundable,dFDA} \\
= \frac{Subsidies_{dFDA,ann}}{Cost_{pragmatic,pt}} \\
= \frac{\$21.8B}{\$929} \\
= 23.4M
\end{gathered}
\]
where:
\[
\begin{gathered}
Subsidies_{dFDA,ann} \\
= Funding_{dFDA,ann} - OPEX_{dFDA} \\
= \$21.8B - \$40M \\
= \$21.8B
\end{gathered}
\]
where:
\[
\begin{gathered}
OPEX_{dFDA} \\
= Cost_{platform} + Cost_{staff} + Cost_{infra} \\
+ Cost_{regulatory} + Cost_{community} \\
= \$15M + \$10M + \$8M + \$5M + \$2M \\
= \$40M
\end{gathered}
\]
10.4 Cost per DALY Derivation
Result: $0.842 (95% CI: $0.242-$1.75)
Step 1: Total protocol infrastructure cost (10-year NPV)
- NPV total cost: $611M (95% CI: $415M-$853M)
Step 2: DALYs averted
Step 3: Calculate cost per DALY
\[
\begin{gathered}
Cost_{direct,DALY} \\
= \frac{NPV_{direct}}{DALYs_{max}} \\
= \frac{\$476B}{565B} \\
= \$0.842
\end{gathered}
\]
where:
\[
NPV_{direct} = Funding_{ann} \times \frac{1 - (1+r)^{-T}}{r}
\]
where:
\[
\begin{gathered}
T_{queue,dFDA} \\
= \frac{T_{queue,SQ}}{k_{capacity}} \\
= \frac{443}{12.3} \\
= 36
\end{gathered}
\]
where:
\[
\begin{gathered}
T_{queue,SQ} \\
= \frac{N_{untreated}}{Treatments_{new,ann}} \\
= \frac{6{,}650}{15} \\
= 443
\end{gathered}
\]
where:
\[
\begin{gathered}
N_{untreated} \\
= N_{rare} \times 0.95 \\
= 7{,}000 \times 0.95 \\
= 6{,}650
\end{gathered}
\]
where:
\[
\begin{gathered}
k_{capacity} \\
= \frac{N_{fundable,dFDA}}{Slots_{curr}} \\
= \frac{23.4M}{1.9M} \\
= 12.3
\end{gathered}
\]
where:
\[
\begin{gathered}
N_{fundable,dFDA} \\
= \frac{Subsidies_{dFDA,ann}}{Cost_{pragmatic,pt}} \\
= \frac{\$21.8B}{\$929} \\
= 23.4M
\end{gathered}
\]
where:
\[
\begin{gathered}
Subsidies_{dFDA,ann} \\
= Funding_{dFDA,ann} - OPEX_{dFDA} \\
= \$21.8B - \$40M \\
= \$21.8B
\end{gathered}
\]
where:
\[
\begin{gathered}
OPEX_{dFDA} \\
= Cost_{platform} + Cost_{staff} + Cost_{infra} \\
+ Cost_{regulatory} + Cost_{community} \\
= \$15M + \$10M + \$8M + \$5M + \$2M \\
= \$40M
\end{gathered}
\]
where:
\[
\begin{gathered}
DALYs_{max} \\
= DALYs_{global,ann} \times Pct_{avoid,DALY} \times T_{accel,max} \\
= 2.88B \times 92.6\% \times 212 \\
= 565B
\end{gathered}
\]
where:
\[
T_{accel,max} = T_{accel} + T_{lag} = 204 + 8.2 = 212
\]
where:
\[
\begin{gathered}
T_{accel} \\
= T_{first,SQ} \times \left(1 - \frac{1}{k_{capacity}}\right) \\
= 222 \times \left(1 - \frac{1}{12.3}\right) \\
= 204
\end{gathered}
\]
where:
\[
\begin{gathered}
T_{first,SQ} \\
= T_{queue,SQ} \times 0.5 \\
= 443 \times 0.5 \\
= 222
\end{gathered}
\]
Comparison: Malaria bed nets cost $89 (95% CI: $78-$100)/DALY. This framework operates at vastly greater scale while achieving competitive cost-effectiveness.
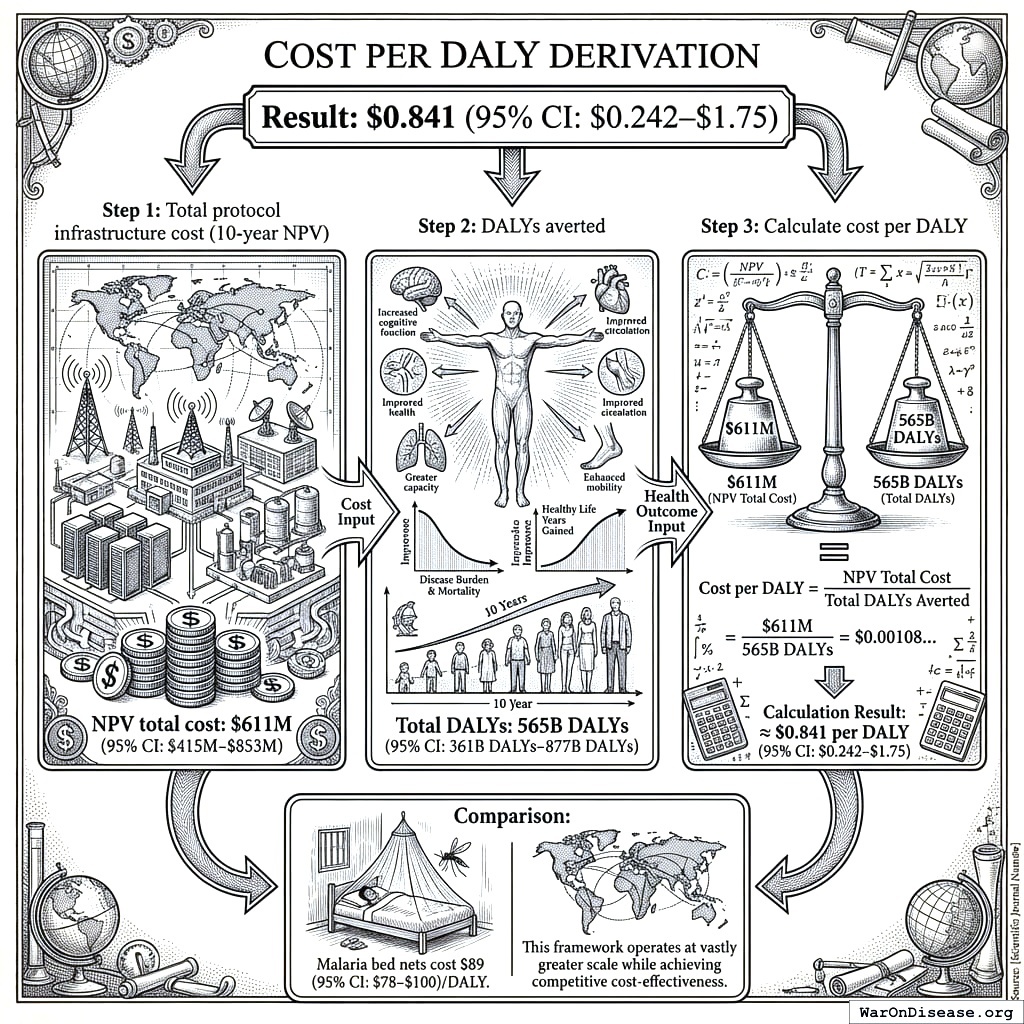
10.5 ROI Derivation
Result: 637 (95% CI: 569-790):1
Step 1: Calculate benefits
- Annual R&D savings: $58.6B (95% CI: $49.2B-$73.1B)
- 10-year NPV of savings: $389B (95% CI: $327B-$485B)
Step 2: Calculate costs
- 10-year NPV total cost: $611M (95% CI: $415M-$853M)
Step 3: Calculate ROI
\[
\begin{gathered}
ROI_{RD} \\
= \frac{NPV_{RD}}{Cost_{dFDA,total}} \\
= \frac{\$389B}{\$611M} \\
= 637
\end{gathered}
\]
where:
\[
\begin{gathered}
NPV_{RD} \\
= \sum_{t=1}^{10} \frac{Savings_{RD,ann} \times \frac{\min(t,5)}{5}}{(1+r)^t}
\end{gathered}
\]
where:
\[
\begin{gathered}
Savings_{RD,ann} \\
= Benefit_{RD,ann} - OPEX_{dFDA} \\
= \$58.6B - \$40M \\
= \$58.6B
\end{gathered}
\]
where:
\[
\begin{gathered}
Benefit_{RD,ann} \\
= Spending_{trials} \times Reduce_{pct} \\
= \$60B \times 97.7\% \\
= \$58.6B
\end{gathered}
\]
where:
\[
\begin{gathered}
Reduce_{pct} \\
= 1 - \frac{Cost_{pragmatic,pt}}{Cost_{P3,pt}} \\
= 1 - \frac{\$929}{\$41K} \\
= 97.7\%
\end{gathered}
\]
where:
\[
\begin{gathered}
OPEX_{dFDA} \\
= Cost_{platform} + Cost_{staff} + Cost_{infra} \\
+ Cost_{regulatory} + Cost_{community} \\
= \$15M + \$10M + \$8M + \$5M + \$2M \\
= \$40M
\end{gathered}
\]
where:
\[
\begin{gathered}
Cost_{dFDA,total} \\
= PV_{OPEX} + Cost_{upfront,total} \\
= \$342M + \$270M \\
= \$611M
\end{gathered}
\]
where:
\[
PV_{OPEX} = OPEX_{ann} \times \frac{1 - (1+r)^{-T}}{r}
\]
where:
\[
\begin{gathered}
OPEX_{total} \\
= OPEX_{ann} + OPEX_{DIH,ann} \\
= \$18.9M + \$21.1M \\
= \$40M
\end{gathered}
\]
where:
\[
\begin{gathered}
Cost_{upfront,total} \\
= Cost_{upfront} + Cost_{DIH,init} \\
= \$40M + \$230M \\
= \$270M
\end{gathered}
\]
10.6 Verification Summary
| Metric | Value | Primary Inputs | Data Sources |
|---|---|---|---|
| Trial Capacity | Funding, trial costs | ADAPTABLE trial, ClinicalTrials.gov | |
| Timeline Shift | Efficacy lag, backlog model | FDA approval data, disease registry | |
| Lives Saved | 10.7 billion deaths (95% CI: 7.4 billion deaths-16.2 billion deaths) |
Mortality rates, timeline | WHO GBD, mortality statistics |
| Cost/DALY | NPV costs, DALYs | ROM estimates, DALY calculations | |
| ROI | 637 (95% CI: 569-790):1 | Costs, savings | NPV analysis with 5-year ramp |
All parameters, confidence intervals, and Monte Carlo distributions are documented in Parameters and Calculations.
11 Key Analytical Assumptions
This analysis rests on several core assumptions that should be made explicit for academic transparency:
11.1 Linear Scaling Assumption
Assumption: Each additional dollar of trial funding produces proportional additional discoveries.
Justification: This is actually conservative - network effects in data aggregation and platform economics often produce increasing returns. We assume linear to avoid overstating benefits.
Sensitivity: If returns are sublinear (diminishing), health impact estimates would be reduced. However, as documented in Addressing the Returns Question, diminishing returns are unlikely when <1% of therapeutic space has been explored.
11.2 Adoption Rate Assumptions
Assumption: Framework adoption follows a 5-year ramp (20%, 40%, 60%, 80%, 100%) before reaching full capacity.
Justification: Based on historical technology adoption curves in healthcare (EHR adoption, telemedicine during COVID). The ramp is built into NPV calculations.
Sensitivity: Slower adoption delays benefits but doesn’t change eventual steady-state impact. NPV is reduced with slower adoption due to discounting.
11.3 Cost Reduction Assumptions
Assumption: Pragmatic trials cost $929 (95% CI: $97-$3K)/patient versus $41K (95% CI: $20K-$120K)/patient for traditional trials.
Justification: Based on ADAPTABLE trial ($929 (95% CI: $929-$1.4K)/patient) and systematic review of 64 pragmatic trials (median $97 (95% CI: $19-$478)/patient). RECOVERY achieved $500 (95% CI: $400-$2.5K)/patient under exceptional NHS/COVID conditions.
Sensitivity: The tornado diagrams show ROI remains strongly positive even at 30% cost reduction (vs. baseline 97.7% (95% CI: 97%-99%)).
11.4 Eventually Avoidable Mortality Assumption
Assumption: 92.6% (95% CI: 50%-98%) of disease deaths are eventually avoidable with sufficient biomedical research.
Justification: Historical trend shows ~70% reduction in age-adjusted mortality since 1900. Most major disease categories have known biological mechanisms amenable to intervention. See Why “Eventually Avoidable” Matters.
Sensitivity: Health impact scales linearly with this assumption. At 25% avoidability (half the estimate), health benefits are halved. R&D savings are unaffected.
11.5 Counterfactual Baseline Specification
This cost-effectiveness analysis uses the status quo as the baseline counterfactual: current clinical trial infrastructure continues operating at current efficiency ($41K (95% CI: $20K-$120K)/patient) and capacity (1.9 million patients/year (95% CI: 1.5 million patients/year-2.3 million patients/year) participants/year). Under this baseline, the $21.8B/year allocated to pragmatic trials would not exist.
Why status quo is the appropriate baseline:
- No comparable interventions exist: There is no competing proposal that would achieve similar trial cost reductions at scale
- Historical trend supports it: Trial costs have increased, not decreased, over the past 50 years (105x (95% CI: 90.6x-119x) since 1962)
- Incremental improvements are marginal: Ongoing digitization efforts (DCT platforms, EHR integration) produce 10-20% efficiency gains, not the 97.7% (95% CI: 97%-99%) reduction from pragmatic trial design
Alternative counterfactual scenarios:
Organic efficiency improvement: Clinical trial costs decrease 2-3% annually through technology adoption. Under this scenario, the marginal impact of the framework is reduced by the amount of improvement that would occur anyway. At 3%/year organic improvement over 10 years, approximately 26% of the cost reduction would occur regardless, reducing the framework’s attributable benefit to ~74% of projections.
Alternative government priorities: Funds are allocated to other health investments (NIH grants, hospital infrastructure, insurance subsidies). Each alternative use would require separate cost-benefit analysis. However, none of these alternatives address the core trial cost problem; they operate within the existing high-cost paradigm.
Return to taxpayers: Funds are returned via tax cuts, enabling private consumption and investment. Under this scenario, the opportunity cost equals the weighted average return on private capital (approximately 3% annually). The framework ROI of 637 (95% CI: 569-790):1 substantially exceeds this threshold.
Methodological note: The analysis uses the neutral status quo baseline to avoid biasing results in either direction. Sensitivity analysis (tornado diagrams) demonstrates robustness across baseline assumptions.
The analysis uses the neutral status quo baseline to avoid biasing results in either direction.
11.6 Methodology Validation Against Accepted Benchmarks
This analysis uses standard health economics methodology identical to that employed by EPA, DOT, GiveWell, NICE, WHO-CHOICE, and CBO:
| Our Method | Equivalent Standard | Institution Using It |
|---|---|---|
| Value of Statistical Life ($10M (95% CI: $5M-$15M)) | VSL for regulatory impact | EPA, DOT, FDA |
| Cost per DALY ($0.842 (95% CI: $0.242-$1.75)/DALY) | ICER thresholds | GiveWell, NICE, WHO-CHOICE |
| Monte Carlo uncertainty propagation | Probabilistic sensitivity analysis | ICER, Cochrane, HTA agencies |
| NPV with discount rate | Standard cost-benefit analysis | CBO, OMB Circular A-94 |
| Long-horizon cumulative impact | Social cost of carbon | EPA, IPCC, Stern Review |
The large headline figures reflect the cumulative value of permanent infrastructure, the same methodology used to value smallpox eradication ($300M program valued at total future lives saved) and climate economics (multi-trillion dollar damage estimates that exceed annual GDP). Our 95% confidence intervals span nearly an order of magnitude, wider than most published health economics studies.
12 Appendix Calculation Frameworks and Detailed Analysis
This appendix provides the detailed models and data used in the cost-benefit analysis.
12.1 Calculation Framework - NPV Methodology
Uses 10-year NPV horizon (standard business practice). See Verification: Complete Derivation Chains for full methodology.
12.2 Financial Analysis Summary
12.2.1 Health Impact Uncertainty Analysis
The Monte Carlo distributions below show the range of health impact estimates across 10,000 simulations, accounting for uncertainty in timeline shift, mortality rates, and avoidable percentages:
Lives Saved Distribution:
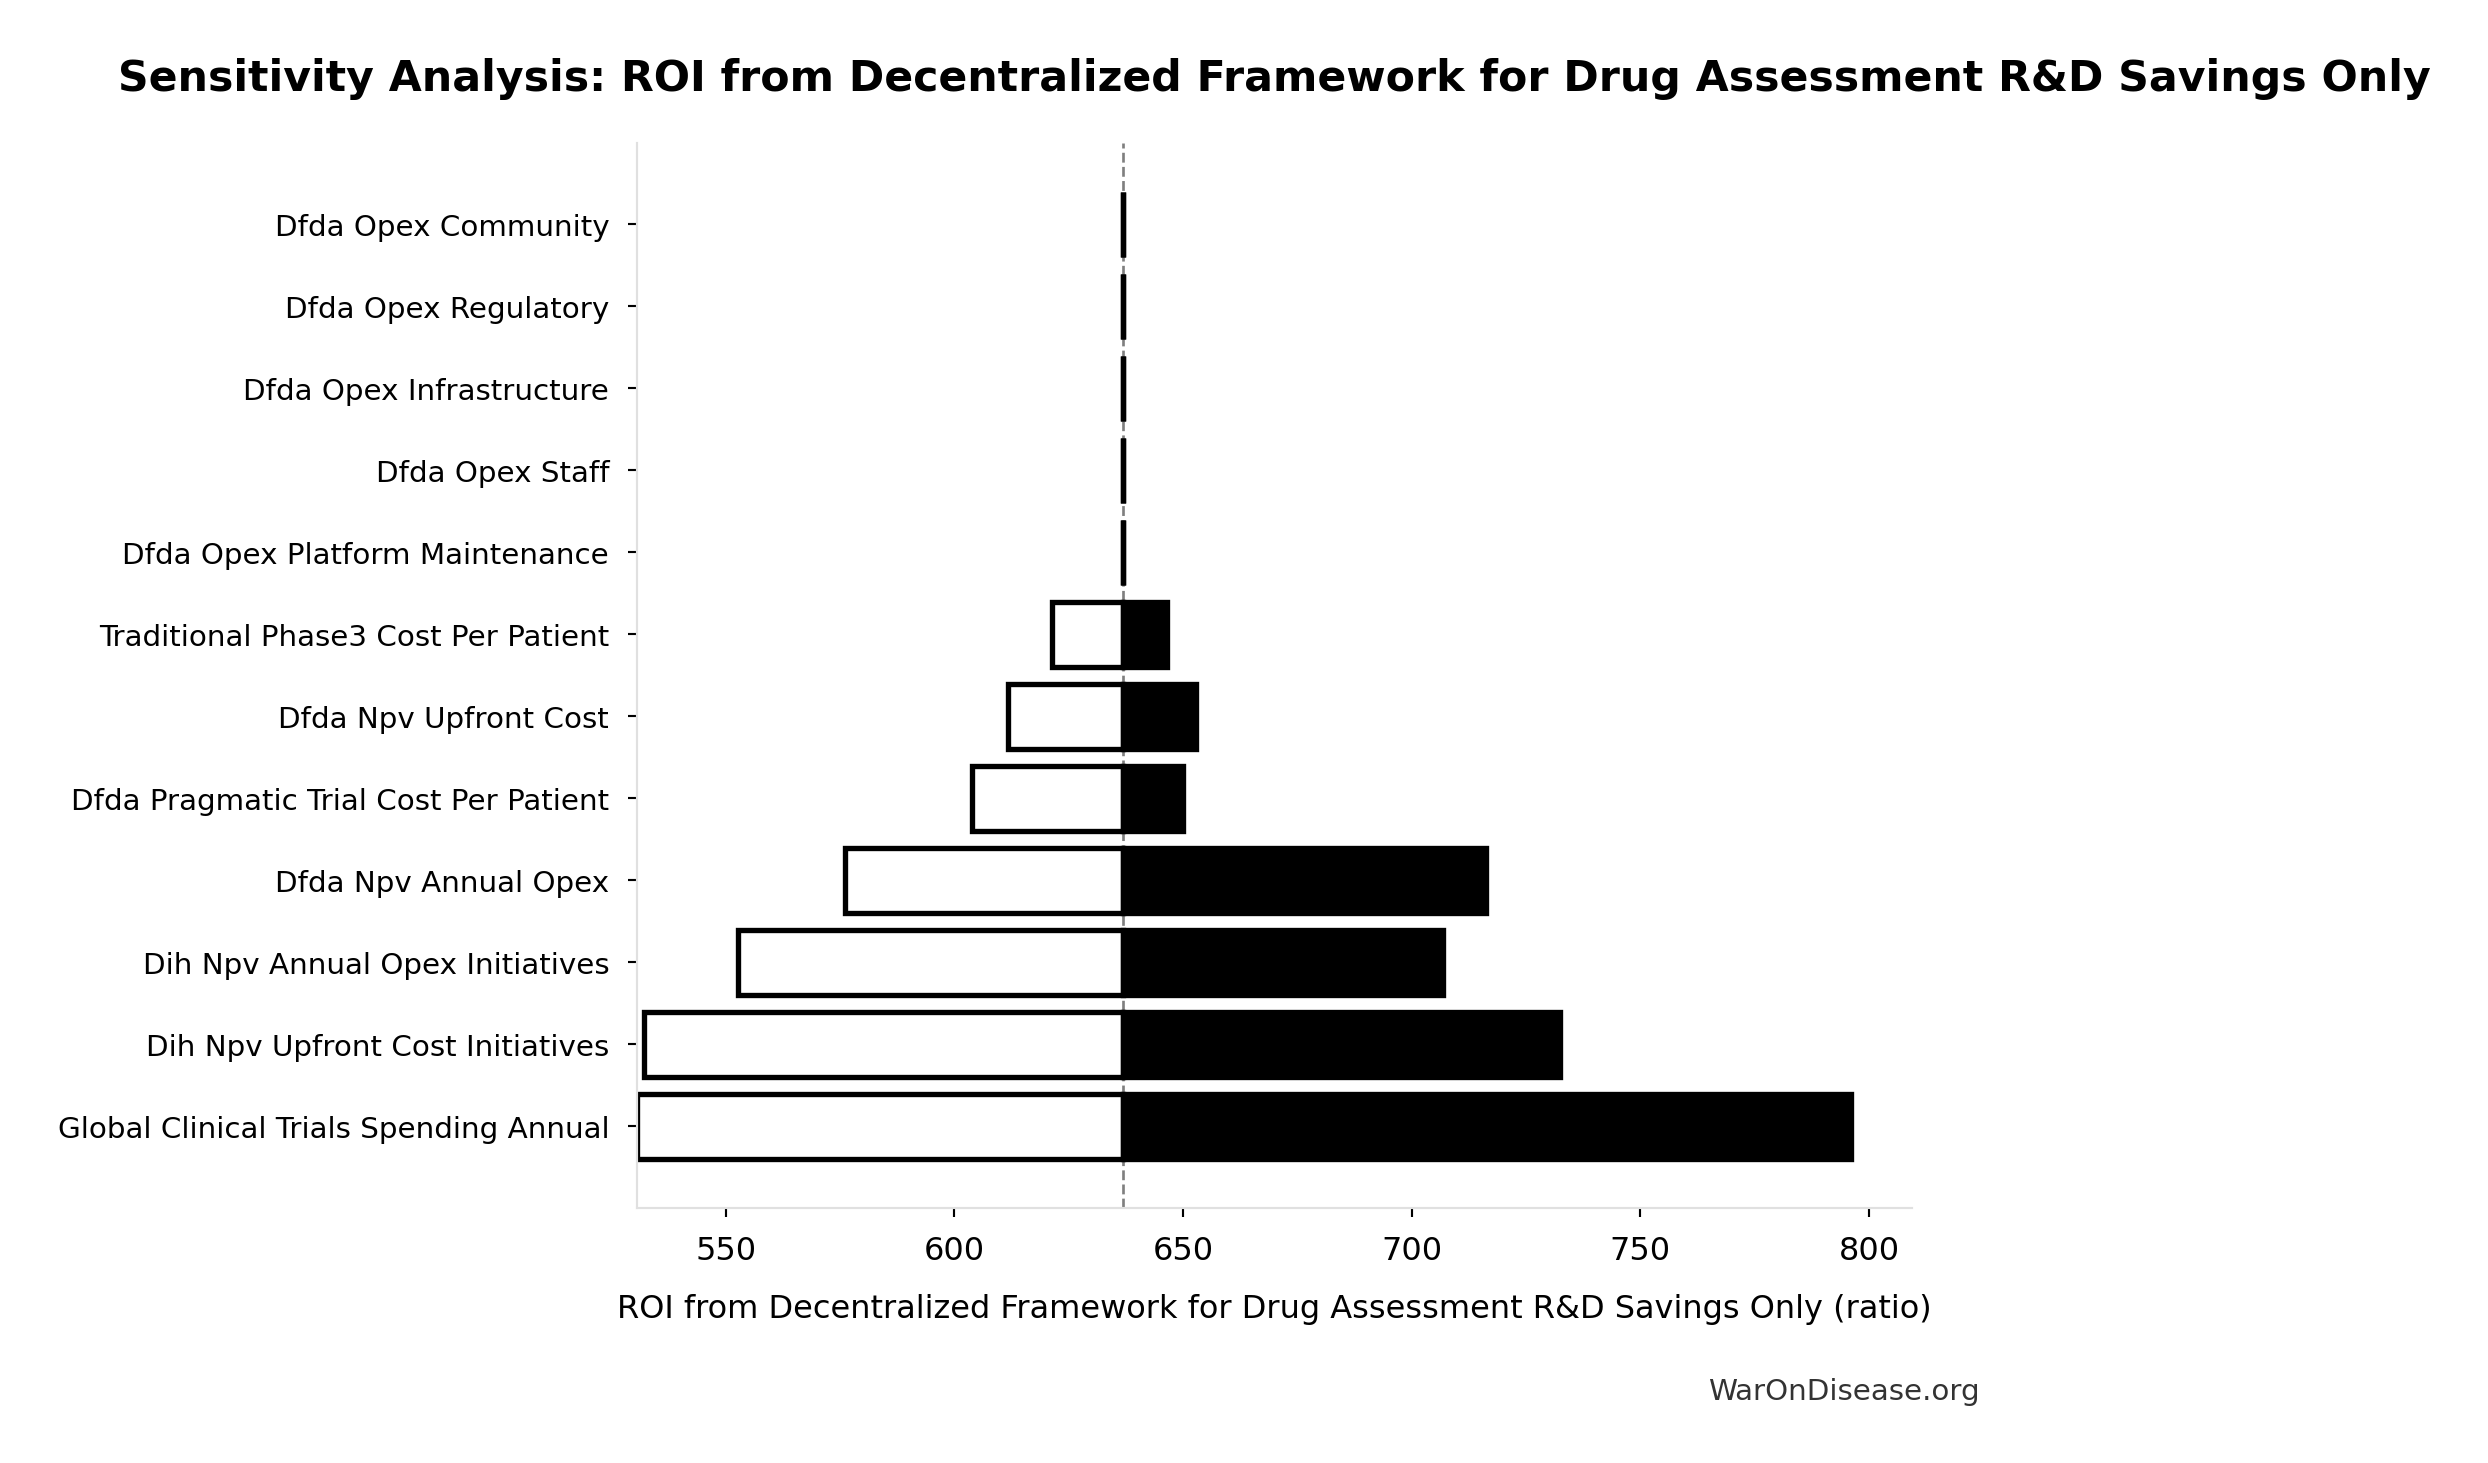
Simulation Results Summary: Total Lives Saved from Elimination of Efficacy Lag Plus Earlier Treatment Discovery from Higher Trial Throughput
| Statistic | Value |
|---|---|
| Baseline (deterministic) | 10.7 billion |
| Mean (expected value) | 11.7 billion |
| Median (50th percentile) | 11.7 billion |
| Standard Deviation | 2.45 billion |
| 90% Range (5th-95th percentile) | [7.4 billion, 16.2 billion] |
The histogram shows the distribution of Total Lives Saved from Elimination of Efficacy Lag Plus Earlier Treatment Discovery from Higher Trial Throughput across 10,000 Monte Carlo simulations. The CDF (right) shows the probability of the outcome exceeding any given value, which is useful for risk assessment.
Economic Value Distribution:
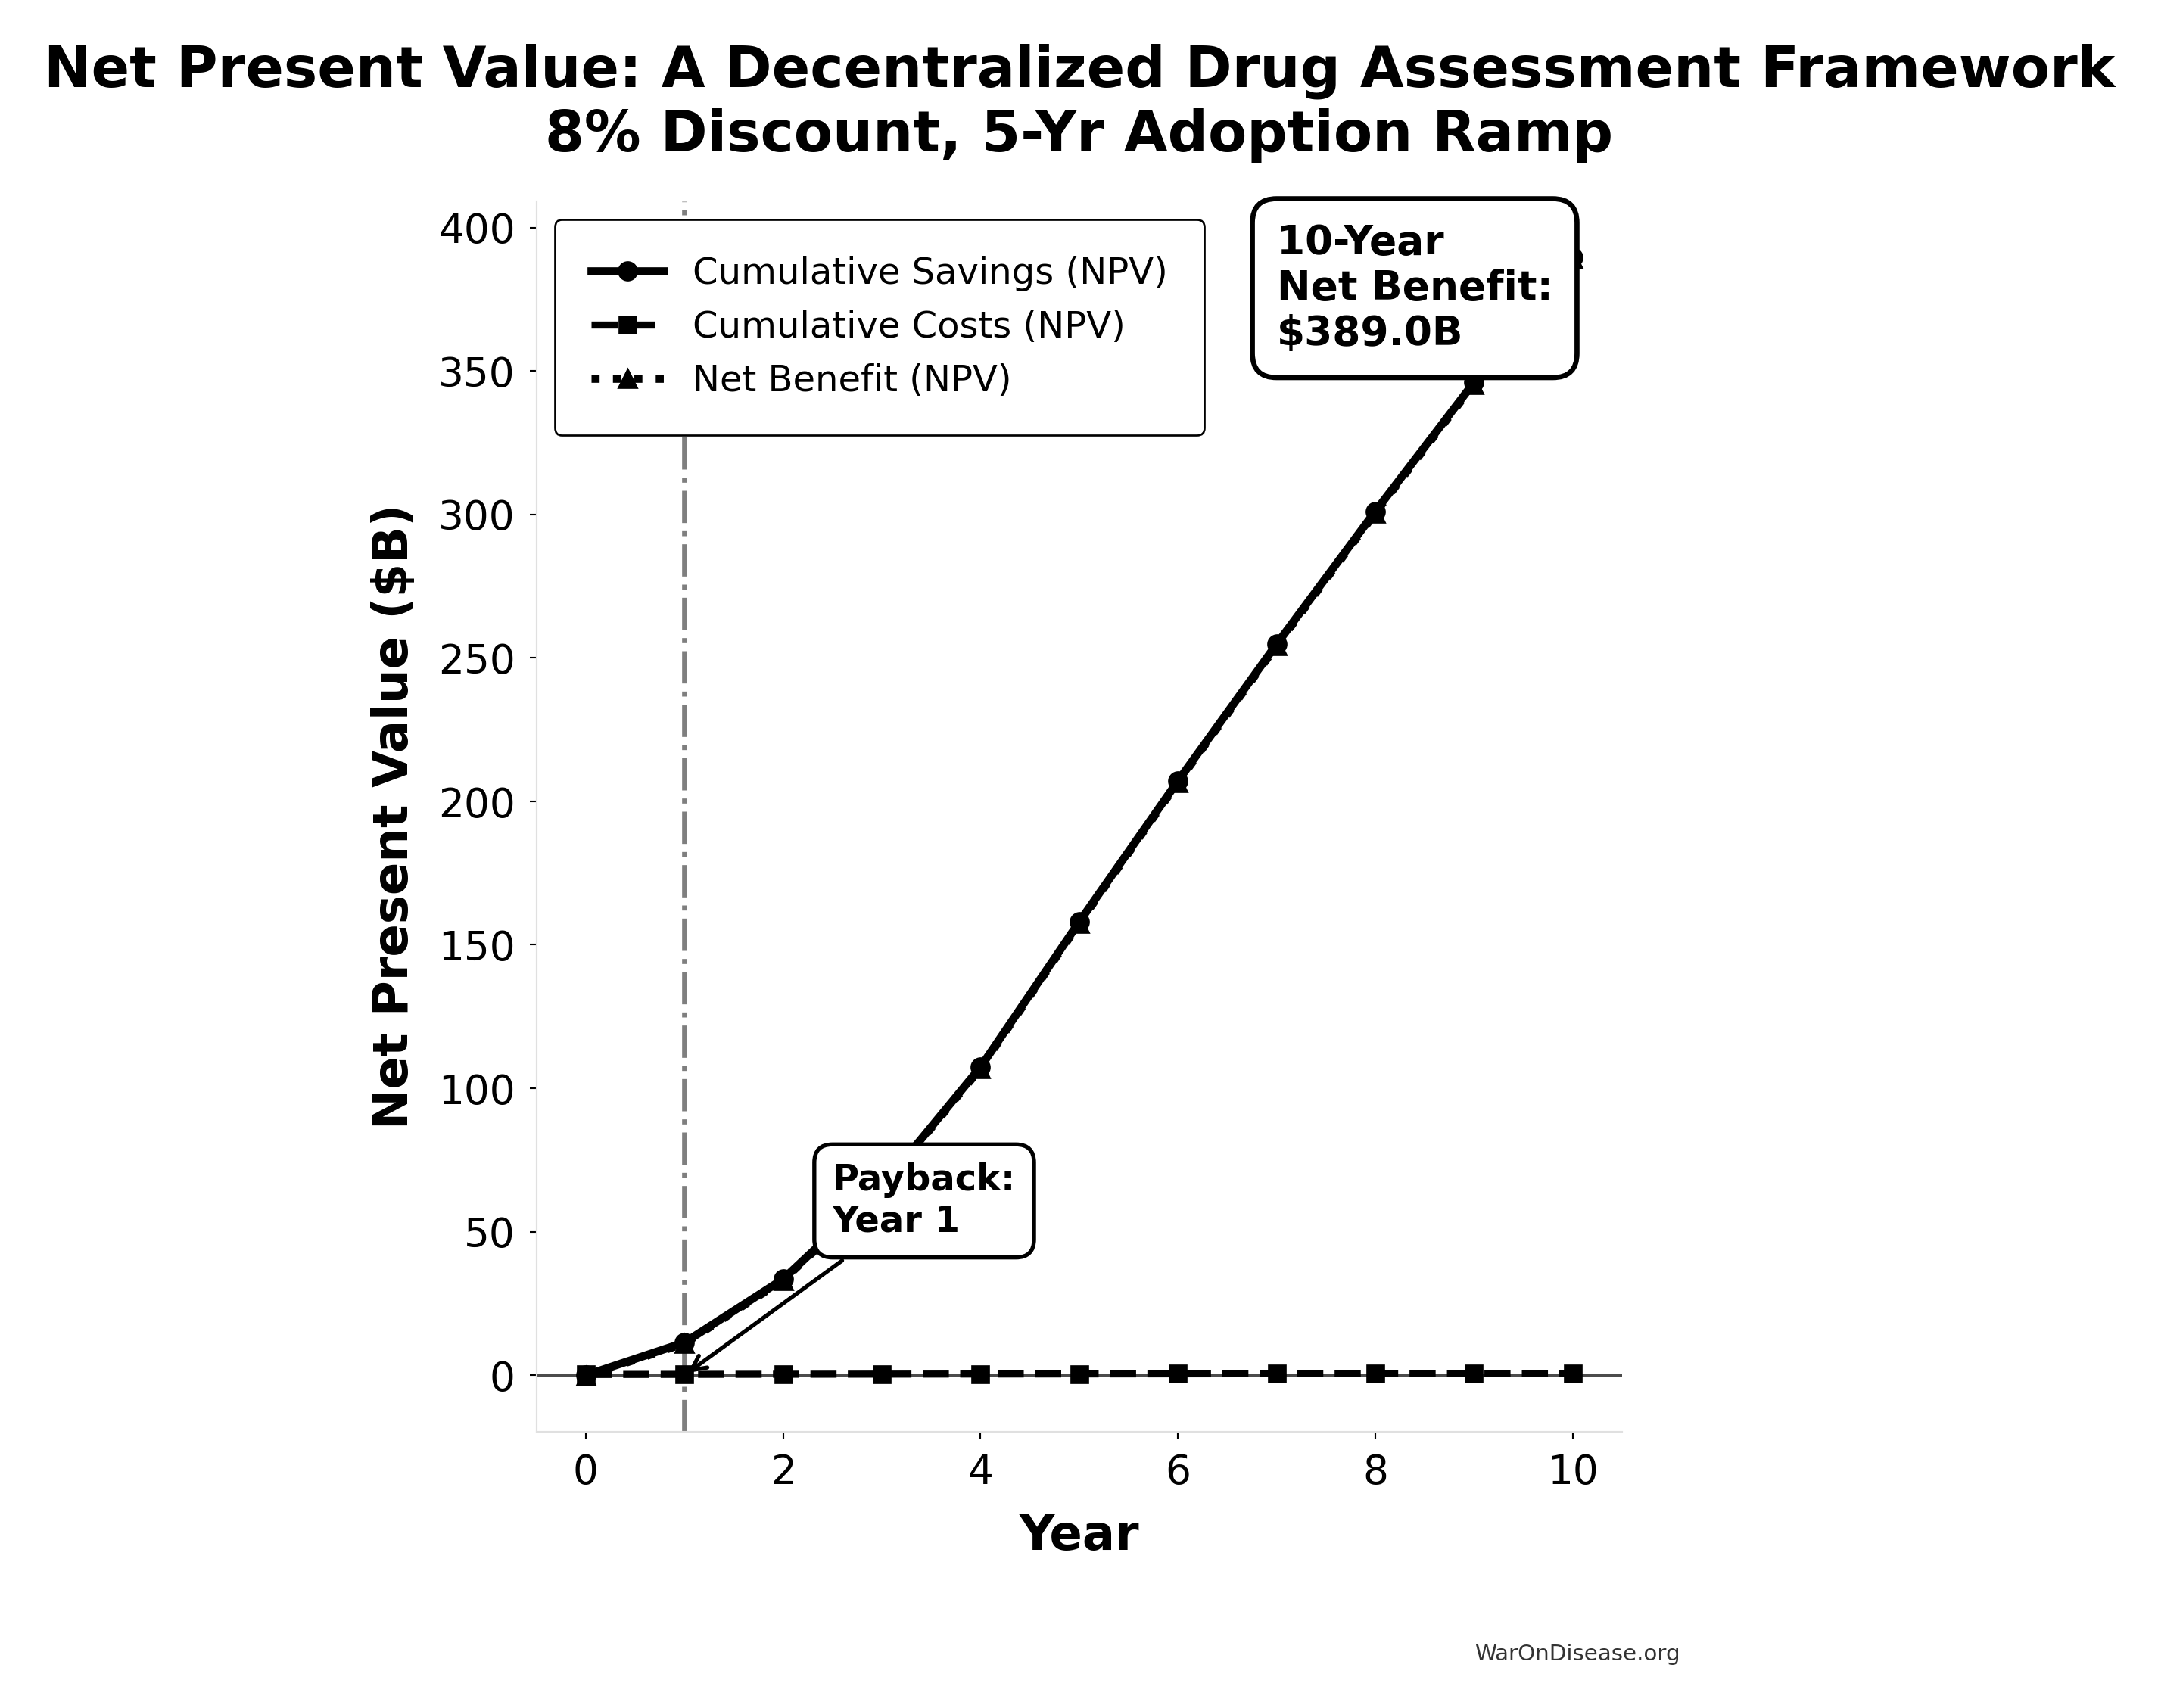
Simulation Results Summary: Total Economic Benefit from Elimination of Efficacy Lag Plus Earlier Treatment Discovery from Higher Trial Throughput
| Statistic | Value |
|---|---|
| Baseline (deterministic) | $84.8 quadrillion |
| Mean (expected value) | $87.8 quadrillion |
| Median (50th percentile) | $92.9 quadrillion |
| Standard Deviation | $11.5 quadrillion |
| 90% Range (5th-95th percentile) | [$62.4 quadrillion, $97.3 quadrillion] |
The histogram shows the distribution of Total Economic Benefit from Elimination of Efficacy Lag Plus Earlier Treatment Discovery from Higher Trial Throughput across 10,000 Monte Carlo simulations. The CDF (right) shows the probability of the outcome exceeding any given value, which is useful for risk assessment.
12.3 Cost-Utility Framework
We present a cost-utility analysis using the quality-adjusted life years (QALYs) and disability-adjusted life years (DALYs) metrics. This approach is the US and global standard for evaluating the value of health interventions145.
QALY: One year of life in perfect health. Gains are calculated as:
\[ \text{QALYs Gained} = (Q_1 \times T_1) - (Q_0 \times T_0) \]
Where \(Q_0\)/\(Q_1\) = quality of life (0-1) before/after, \(T_0\)/\(T_1\) = years of life before/after.
Cost-Effectiveness: A decentralized FDA achieves cost-effectiveness through dual pathways:
- R&D Savings: $58.6B (95% CI: $49.2B-$73.1B)+ annual savings from 97.7% (95% CI: 97%-99%) trial cost reduction
- Health Gains: 565 billion DALYs (95% CI: 361 billion DALYs-877 billion DALYs) averted from the full timeline shift (~212 years (95% CI: 135 years-355 years) from 12.3x (95% CI: 4.2x-61.4x) trial capacity + efficacy lag elimination)
This combination creates a dominant intervention: simultaneously saves money and improves health outcomes.
US Willingness-to-Pay Threshold: Typically $100,000–$150,000 per QALY for interventions that add costs. Dominant interventions that both save money and improve health are favorable regardless of this threshold.
Sources for Context:
- QALY methodology and standards145: “The quality-adjusted life year (QALY) is the academic standard for measuring how well all different kinds of medical treatments lengthen and/or improve patients’ lives…”
- Health economic evaluation96: Standard health economic analysis considers cost-effectiveness across intervention types.
12.3.1 QALY Benefit Streams Breakdown
The total DALY impact (565 billion DALYs (95% CI: 361 billion DALYs-877 billion DALYs)) derives from three distinct benefit streams with varying levels of empirical support:
A. Accelerated Development of Existing Pipeline Drugs
Health gains from bringing effective treatments to patients faster through shortened development and approval timelines:
- Baseline: Research shows treatment delays significantly increase mortality. Cancer studies indicate approximately 10% increased mortality risk per month of delay.
- Mechanism: 12.3x (95% CI: 4.2x-61.4x) trial capacity reduces average development time
- Confidence: High. Well-documented costs of delayed access (84,000 life-years lost per year of delay in cancer therapies alone)
B. Improved Preventative Care via Real-World Evidence
Value of using comprehensive data to optimize preventative care and treatment effectiveness:
- Baseline: Cancer screenings alone have saved millions of life-years; significant untapped potential remains
- Mechanism: Large-scale identification of at-risk populations and real-world effectiveness measurement enables personalized prevention
- Confidence: Medium. Preventative care benefits are well-established, but scale of improvement from comprehensive data remains uncertain
C. Enabling Research for Previously Untreatable Diseases
Transformative potential to create viable research pathways for conditions ignored due to high trial costs:
- Baseline: 7 thousand diseases (95% CI: 6 thousand diseases-10 thousand diseases)+ rare diseases, 95% lack FDA-approved treatments
- Mechanism: Radically lower per-patient costs ($929 (95% CI: $97-$3K) vs $41K (95% CI: $20K-$120K)) make rare disease R&D economically feasible
- Confidence: Lower. Economic viability of rare disease research is theoretically sound but empirically unproven at scale
Conservative Approach: Base case uses median estimates across all three streams; sensitivity analysis demonstrates positive returns even when using R&D savings alone (637 (95% CI: 569-790):1 ROI independent of health benefits).
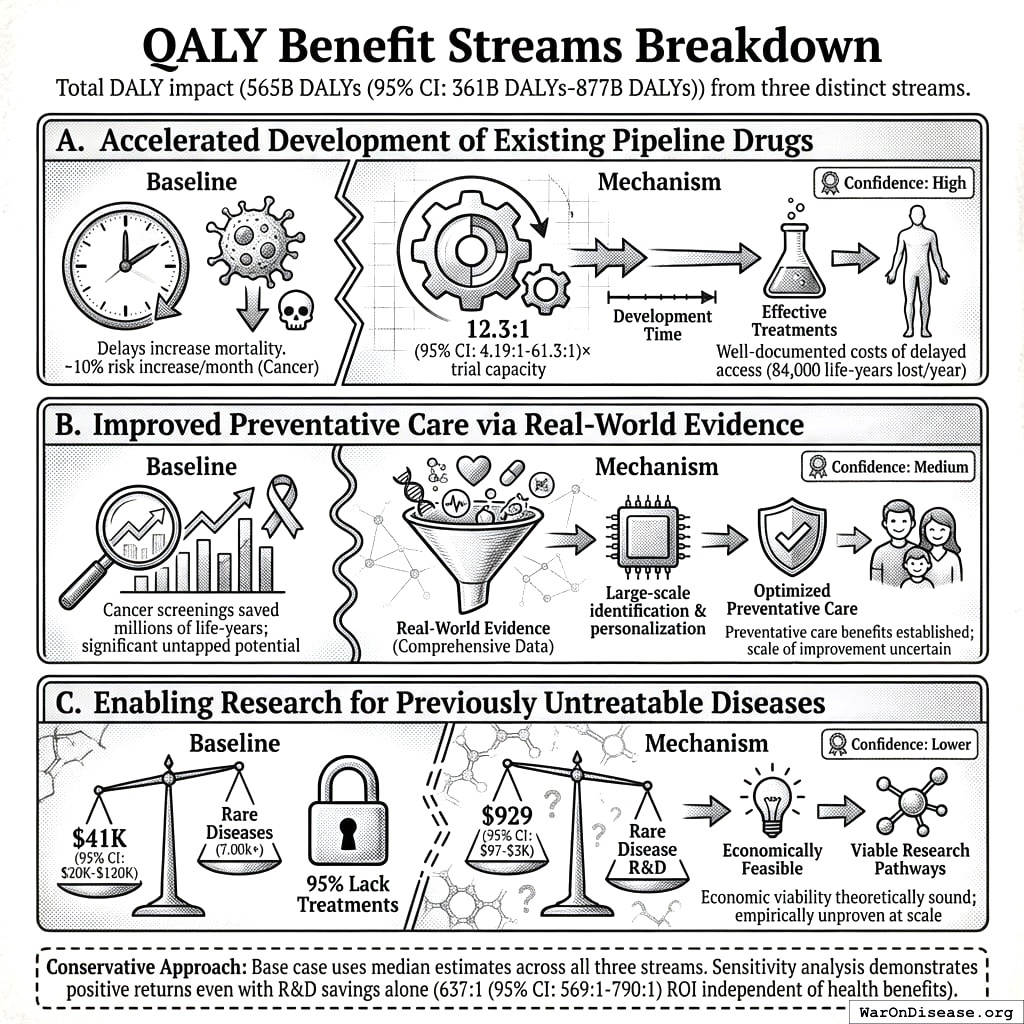
12.3.2 DALY Sensitivity Analysis
The following auto-generated sensitivity analyses show how cost-effectiveness varies based on uncertainty in input parameters. These use Monte Carlo simulation with uncertainty propagation from parameter distributions.
Key DALY Outcomes:
Sensitivity Indices for Total DALYs from Elimination of Efficacy Lag Plus Earlier Treatment Discovery from Higher Trial Throughput
Regression-based sensitivity showing which inputs explain the most variance in the output.
| Input Parameter | Sensitivity Coefficient | Interpretation |
|---|---|---|
| dFDA Average Total Timeline Shift (years) | 0.8999 | Strong driver |
| Eventually Avoidable DALY Percentage (percentage) | 0.4866 | Moderate driver |
| Global Annual DALY Burden (DALYs/year) | 0.0432 | Minimal effect |
Interpretation: Standardized coefficients show the change in output (in SD units) per 1 SD change in input. Values near ±1 indicate strong influence; values exceeding ±1 may occur with correlated inputs.
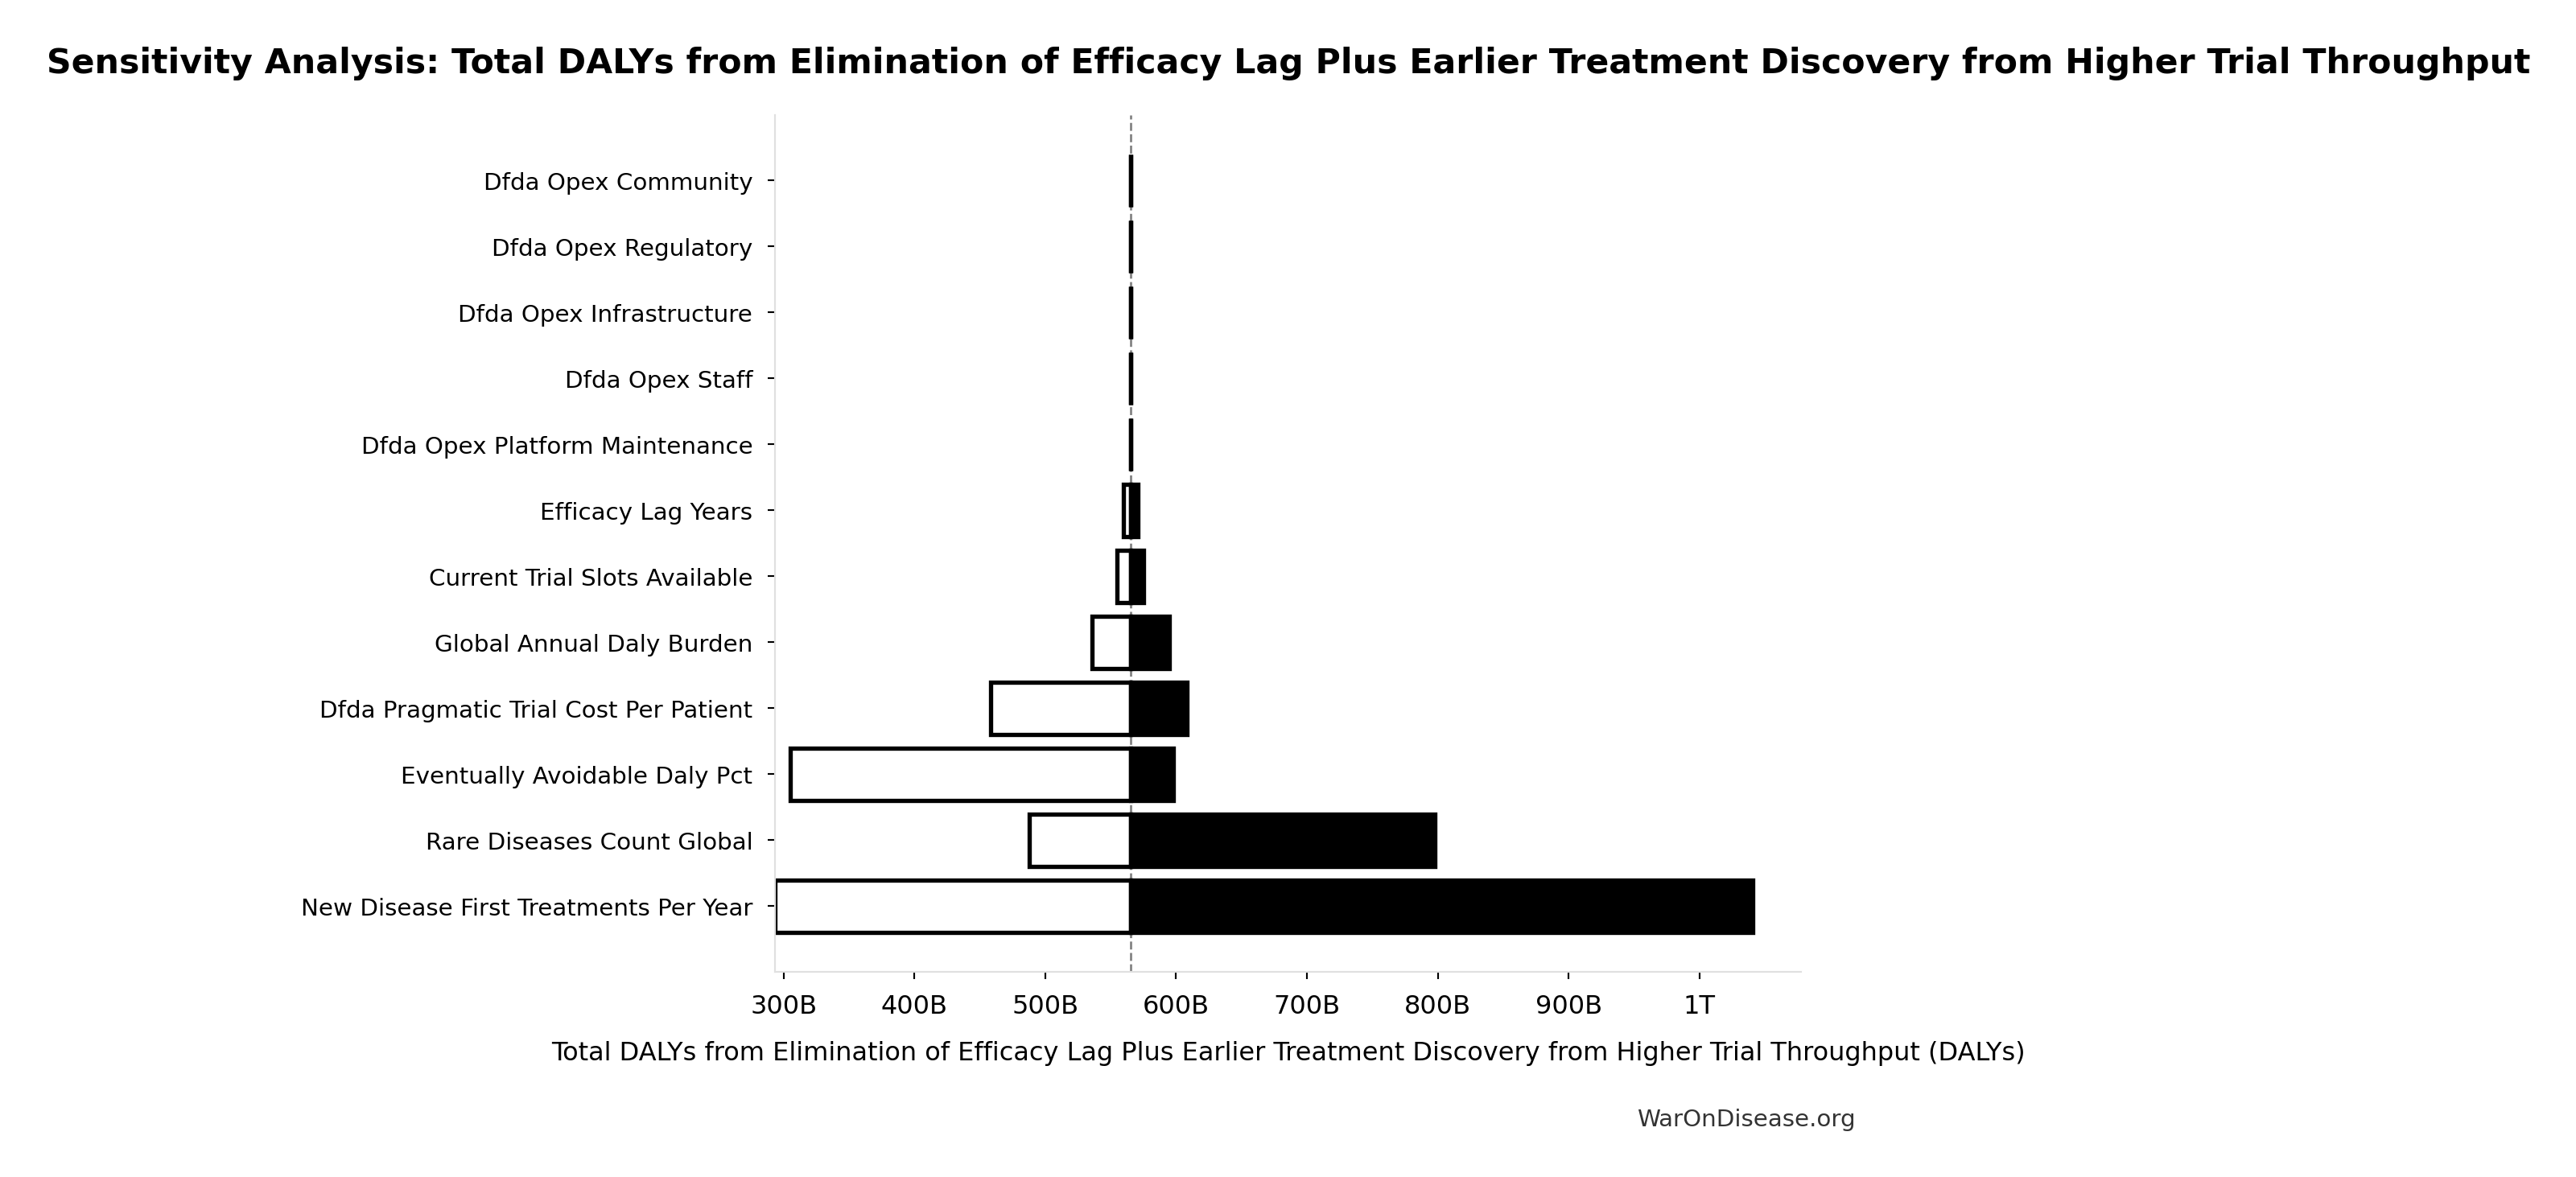
12.4 Comparative Cost-Effectiveness - A Decentralized Framework vs Other Interventions
To provide context for the impact of a global pragmatic trial system’s infrastructure, the chart below visualizes its cost-effectiveness against other well-understood public health programs. The metric used is Quality-Adjusted Life Years (QALYs) Gained per $1 Million of Spending. A higher number signifies greater cost-effectiveness.
For standard interventions, this value is calculated as $1,000,000 / ICER, where the ICER (Incremental Cost-Effectiveness Ratio) is the cost to gain one QALY. For dominant interventions that are both more effective and less expensive, the ICER is negative, and this metric isn’t strictly applicable. For these cases, an illustrative range is used to represent their high value.
All data used in the chart is derived from the table and sources below.
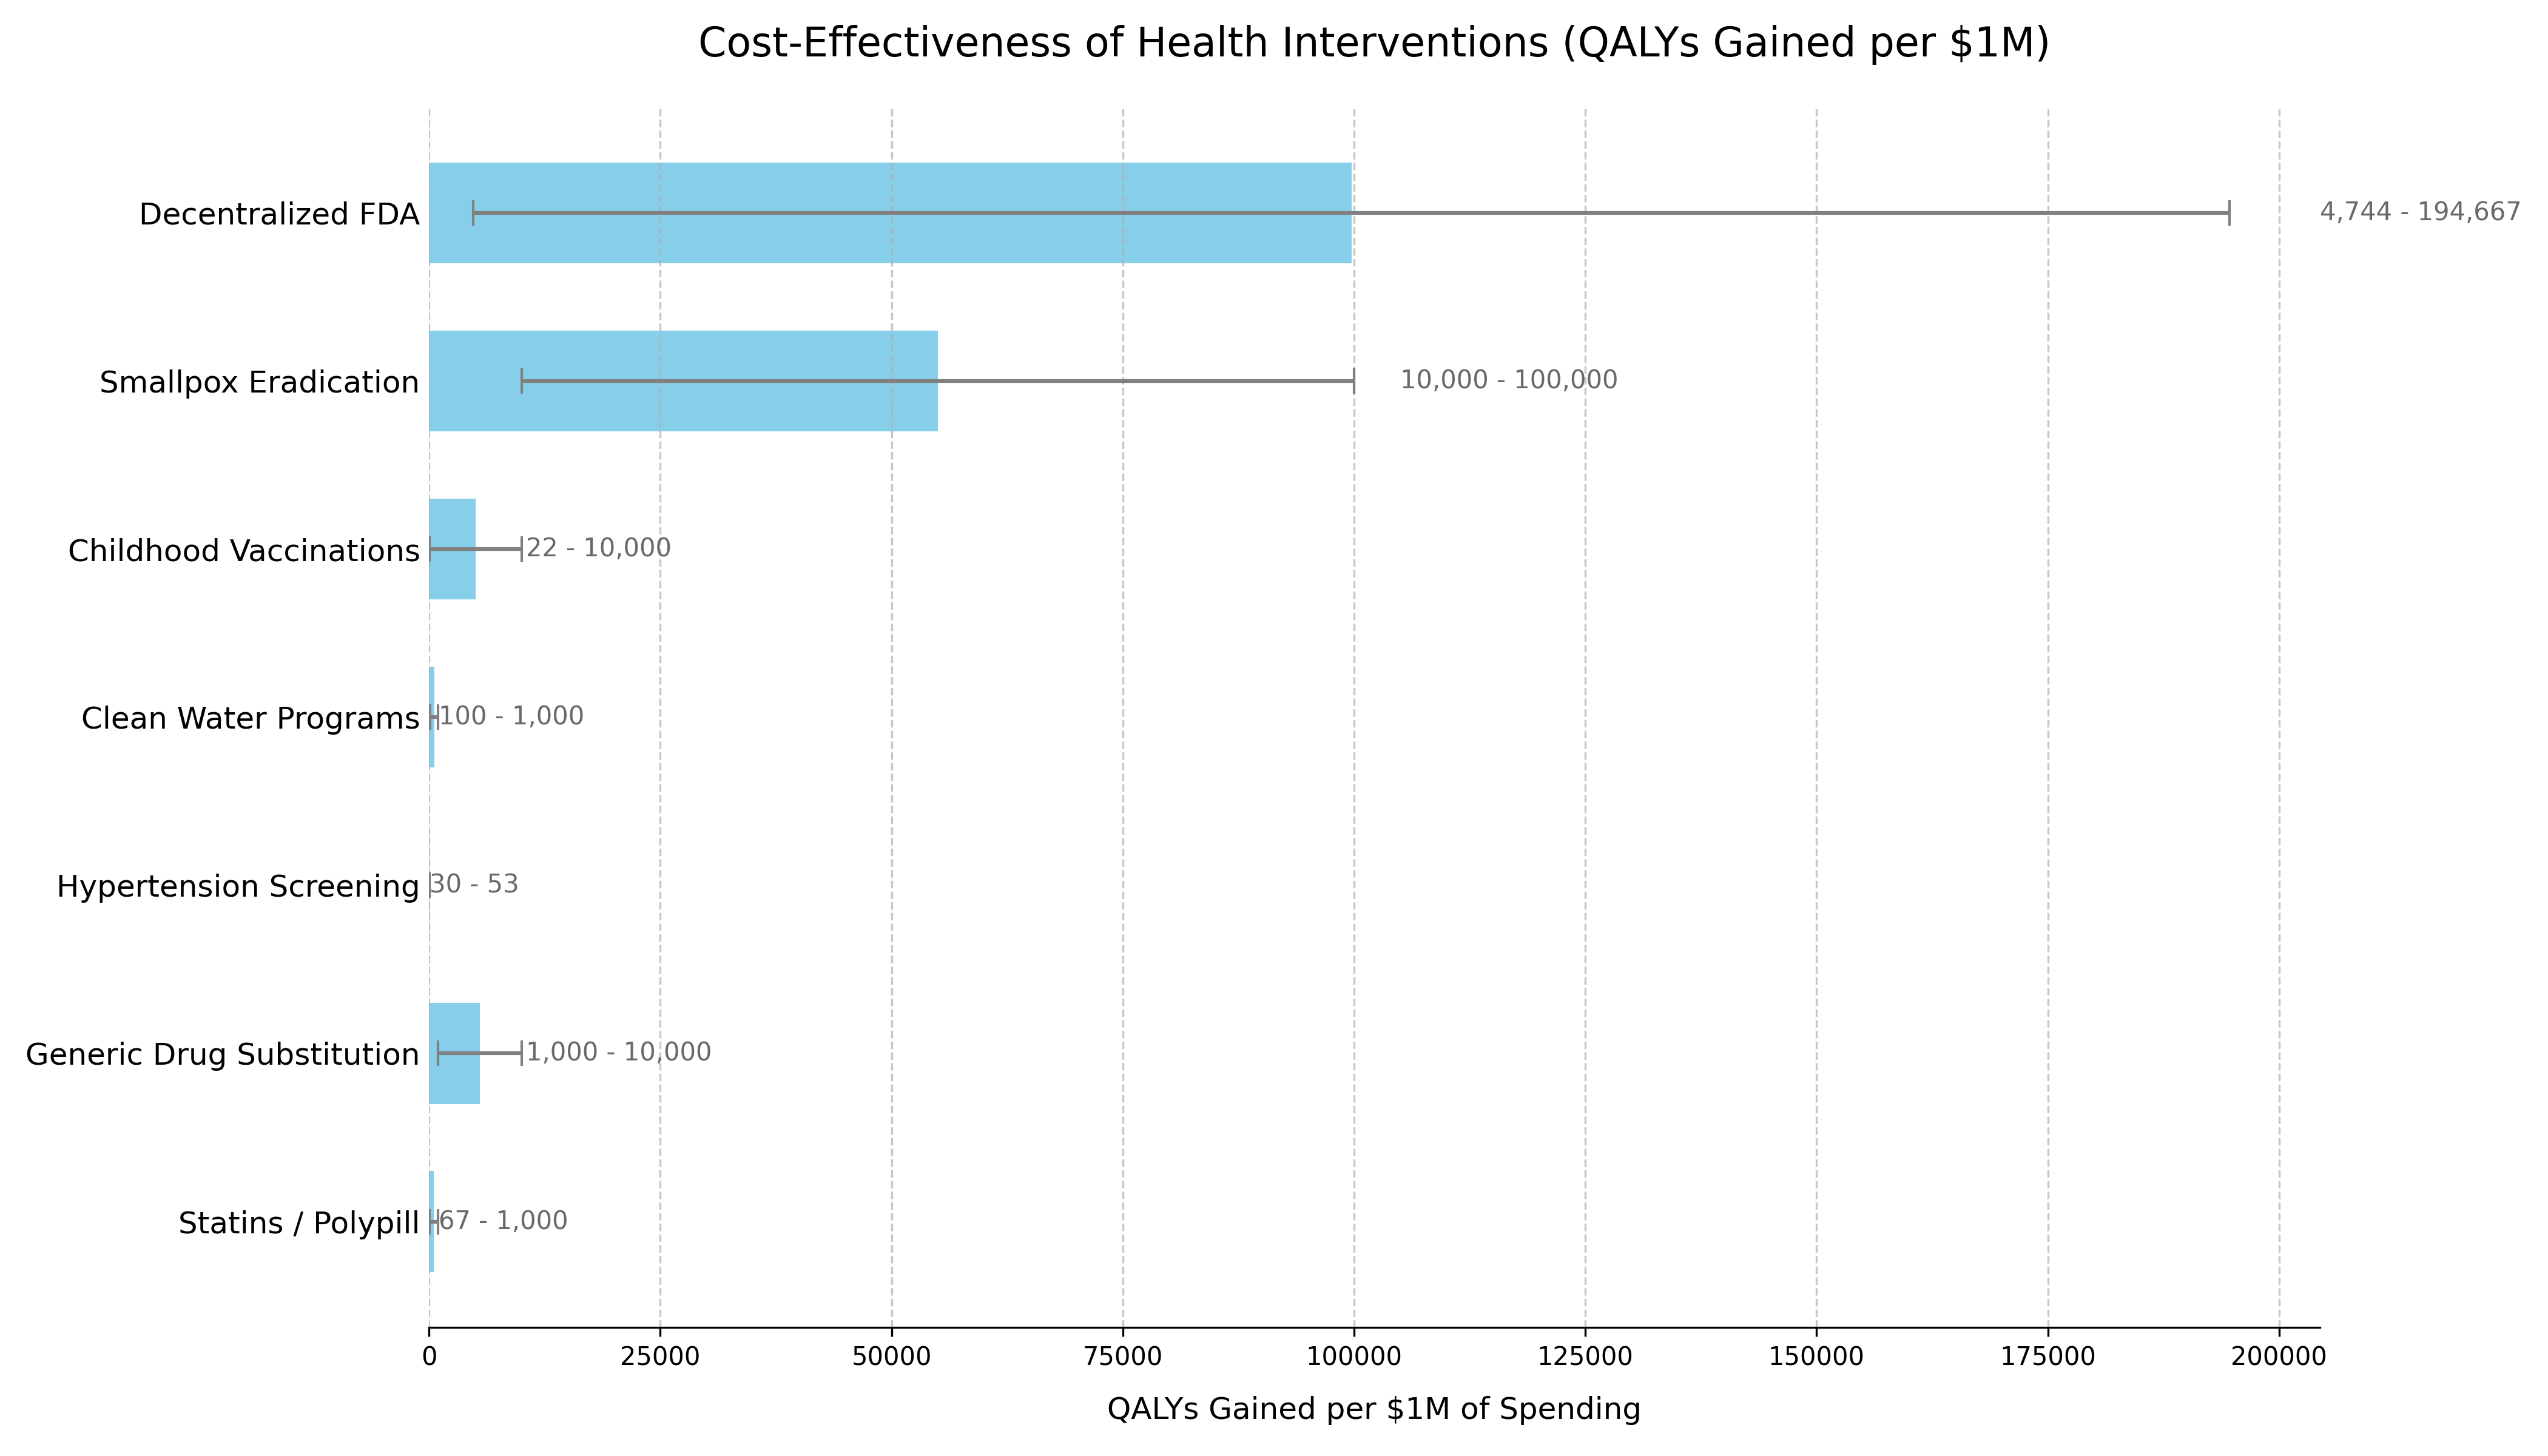
The following table provides the data and sources that support the chart. The list is ordered to match the chart’s presentation.
| Intervention | QALYs Gained per $1M Spending¹ | Typical ICER Range (Cost per QALY Gained) | Classification | Source / Evidence |
|---|---|---|---|---|
| Decentralized Framework for Drug Assessment | Dominant | Cost-Saving + Health Gain | Dominant | This analysis’s Sensitivity Analysis. Based on $18.9M (95% CI: $11M-$26.5M)-$40M (95% CI: $27.5M-$55.4M) annual costs generating 565 billion DALYs (95% CI: 361 billion DALYs-877 billion DALYs) from ~212 years (95% CI: 135 years-355 years) timeline shift. |
| Smallpox Eradication | 100,000+³ | Dominant (Cost-Saving) | Dominant | The $300M program (1967-1980) prevents 5M annual deaths. Benefit-cost ratio exceeds 100:1. Standard ICER calculation is impractical due to its uncommon scale. (WHO, 2010146) |
| Childhood Vaccinations | 22+³ | Often Dominant to ~$100,000 | Dominant / Highly Cost-Effective | CDC estimates routine childhood vaccinations prevent 32M hospitalizations and 1.1M deaths among 1994-2023 US birth cohorts, with $2.9T in societal cost savings. (CDC, 2023147) |
| Clean Water Programs | 100 | ~$1,000 - $10,000 | Highly Cost-Effective | WHO estimates household water treatment costs $100-$500/DALY averted. Community water supply improvements cost $200/DALY. (WHO, 2004148) |
| Hypertension Screening | 30 - 50 | ~$20,000 - $33,000 | Highly Cost-Effective | Recent US studies show pharmacist-led hypertension management has ICERs in the $20,000-$33,000 range per QALY gained, falling within standard willingness-to-pay thresholds. (JAMA Netw Open, 2023149) |
| Generic Drug Substitution | +³ | Dominant (Cost-Saving) | Dominant | By definition cost-saving when therapeutic equivalence is maintained, with typical savings of 30-80% versus brand-name drugs. (WHO, 2015150) |
| Statins / Polypill | 67+³ | Cost-Saving to ~$15,000 | Dominant / Highly Cost-Effective | Cost-saving in high-risk populations. ICERs range from dominant to $15k/QALY in lower-risk groups. (eClinicalMedicine, 2022151) |
| Pragmatic Trials (RECOVERY model) | ~250,000 | $4 (95% CI: $1.71-$10)/QALY | Highly Cost-Effective | UK RECOVERY trial: $20M (95% CI: $15M-$25M) spent, saving 1 million lives (95% CI: 500 thousand lives-2 million lives) globally via dexamethasone discovery. 44.1x (95% CI: 39.4x-89.1x) cheaper per patient than traditional Phase 3 trials. (Note: RECOVERY’s $500 (95% CI: $400-$2.5K)/patient benefited from NHS infrastructure; ADAPTABLE achieved $929 (95% CI: $929-$1.4K)/patient in US settings.) |
| NIH Standard Research Portfolio | ~20 | $50K (95% CI: $20K-$100K)/QALY | Inefficient Baseline | Standard NIH-funded research. Represents current status quo efficiency.71 |
12.5 Methodology Notes
- For a decentralized framework:
(Annual QALYs Gained) / (Annual Cost in Millions) - Ranges reflect conservative to optimistic scenarios accounting for parameter uncertainties
² Cost-Dominant Interpretation:
- All scenarios for the framework show extremely low cost per DALY while generating net economic benefits that exceed costs
- The framework is “dominant” - more effective and less costly than the status quo
- For cost-saving (dominant) interventions, standard QALY/$1M calculations are not applicable
- Values shown are illustrative to demonstrate relative cost-effectiveness
- Upper bounds represent the exceptional value of these interventions
12.6 Data Limitations
- Historical interventions (e.g., smallpox) use retrospective analyses
- Direct comparisons between interventions should consider contextual differences
- All costs are in 2023 USD, adjusted using appropriate health inflation indices
- QALY calculations use standard health state utility weights where available
13 Comparison to Other Major Public Investments
To provide context for the estimated costs of a global pragmatic trial system, it is useful to compare them to other significant U.S. government investments in health and technology. The projected ‘Lean Ecosystem’ cost for the framework of approximately $40M (95% CI: $27.5M-$55.4M) per year (covering Core framework operations plus medium-scope broader initiatives) is modest in comparison to other major federal projects.
| Initiative / Project | Approximate Cost / Budget (Annualized) | Comparison to Framework’s Annual Cost | Source / Note |
|---|---|---|---|
| Decentralized Framework (Lean Ecosystem) | ~$40M (95% CI: $27.5M-$55.4M) / year | 1x (Baseline) | This analysis |
| Cancer Moonshot Initiative | ~$257 Million / year152 ($1.8B over 7 years) | ~6.4x | 21st Century Cures Act153 |
| NIH “All of Us” Research Program | ~$500M / year (FY23 Approx. Budget) | ~12.5x | NIH Budget50 |
| HealthCare.gov (Initial Build) | ~$1.7 - $2.1 Billion154 (Total Upfront Cost) | ~42x - 52x (of one year’s cost) | GAO Reports / Public Reporting154 |
| National Cancer Institute (NCI) | ~$7.2 Billion / year155 (FY25 Budget) | ~180x | NCI Budget Data155 |
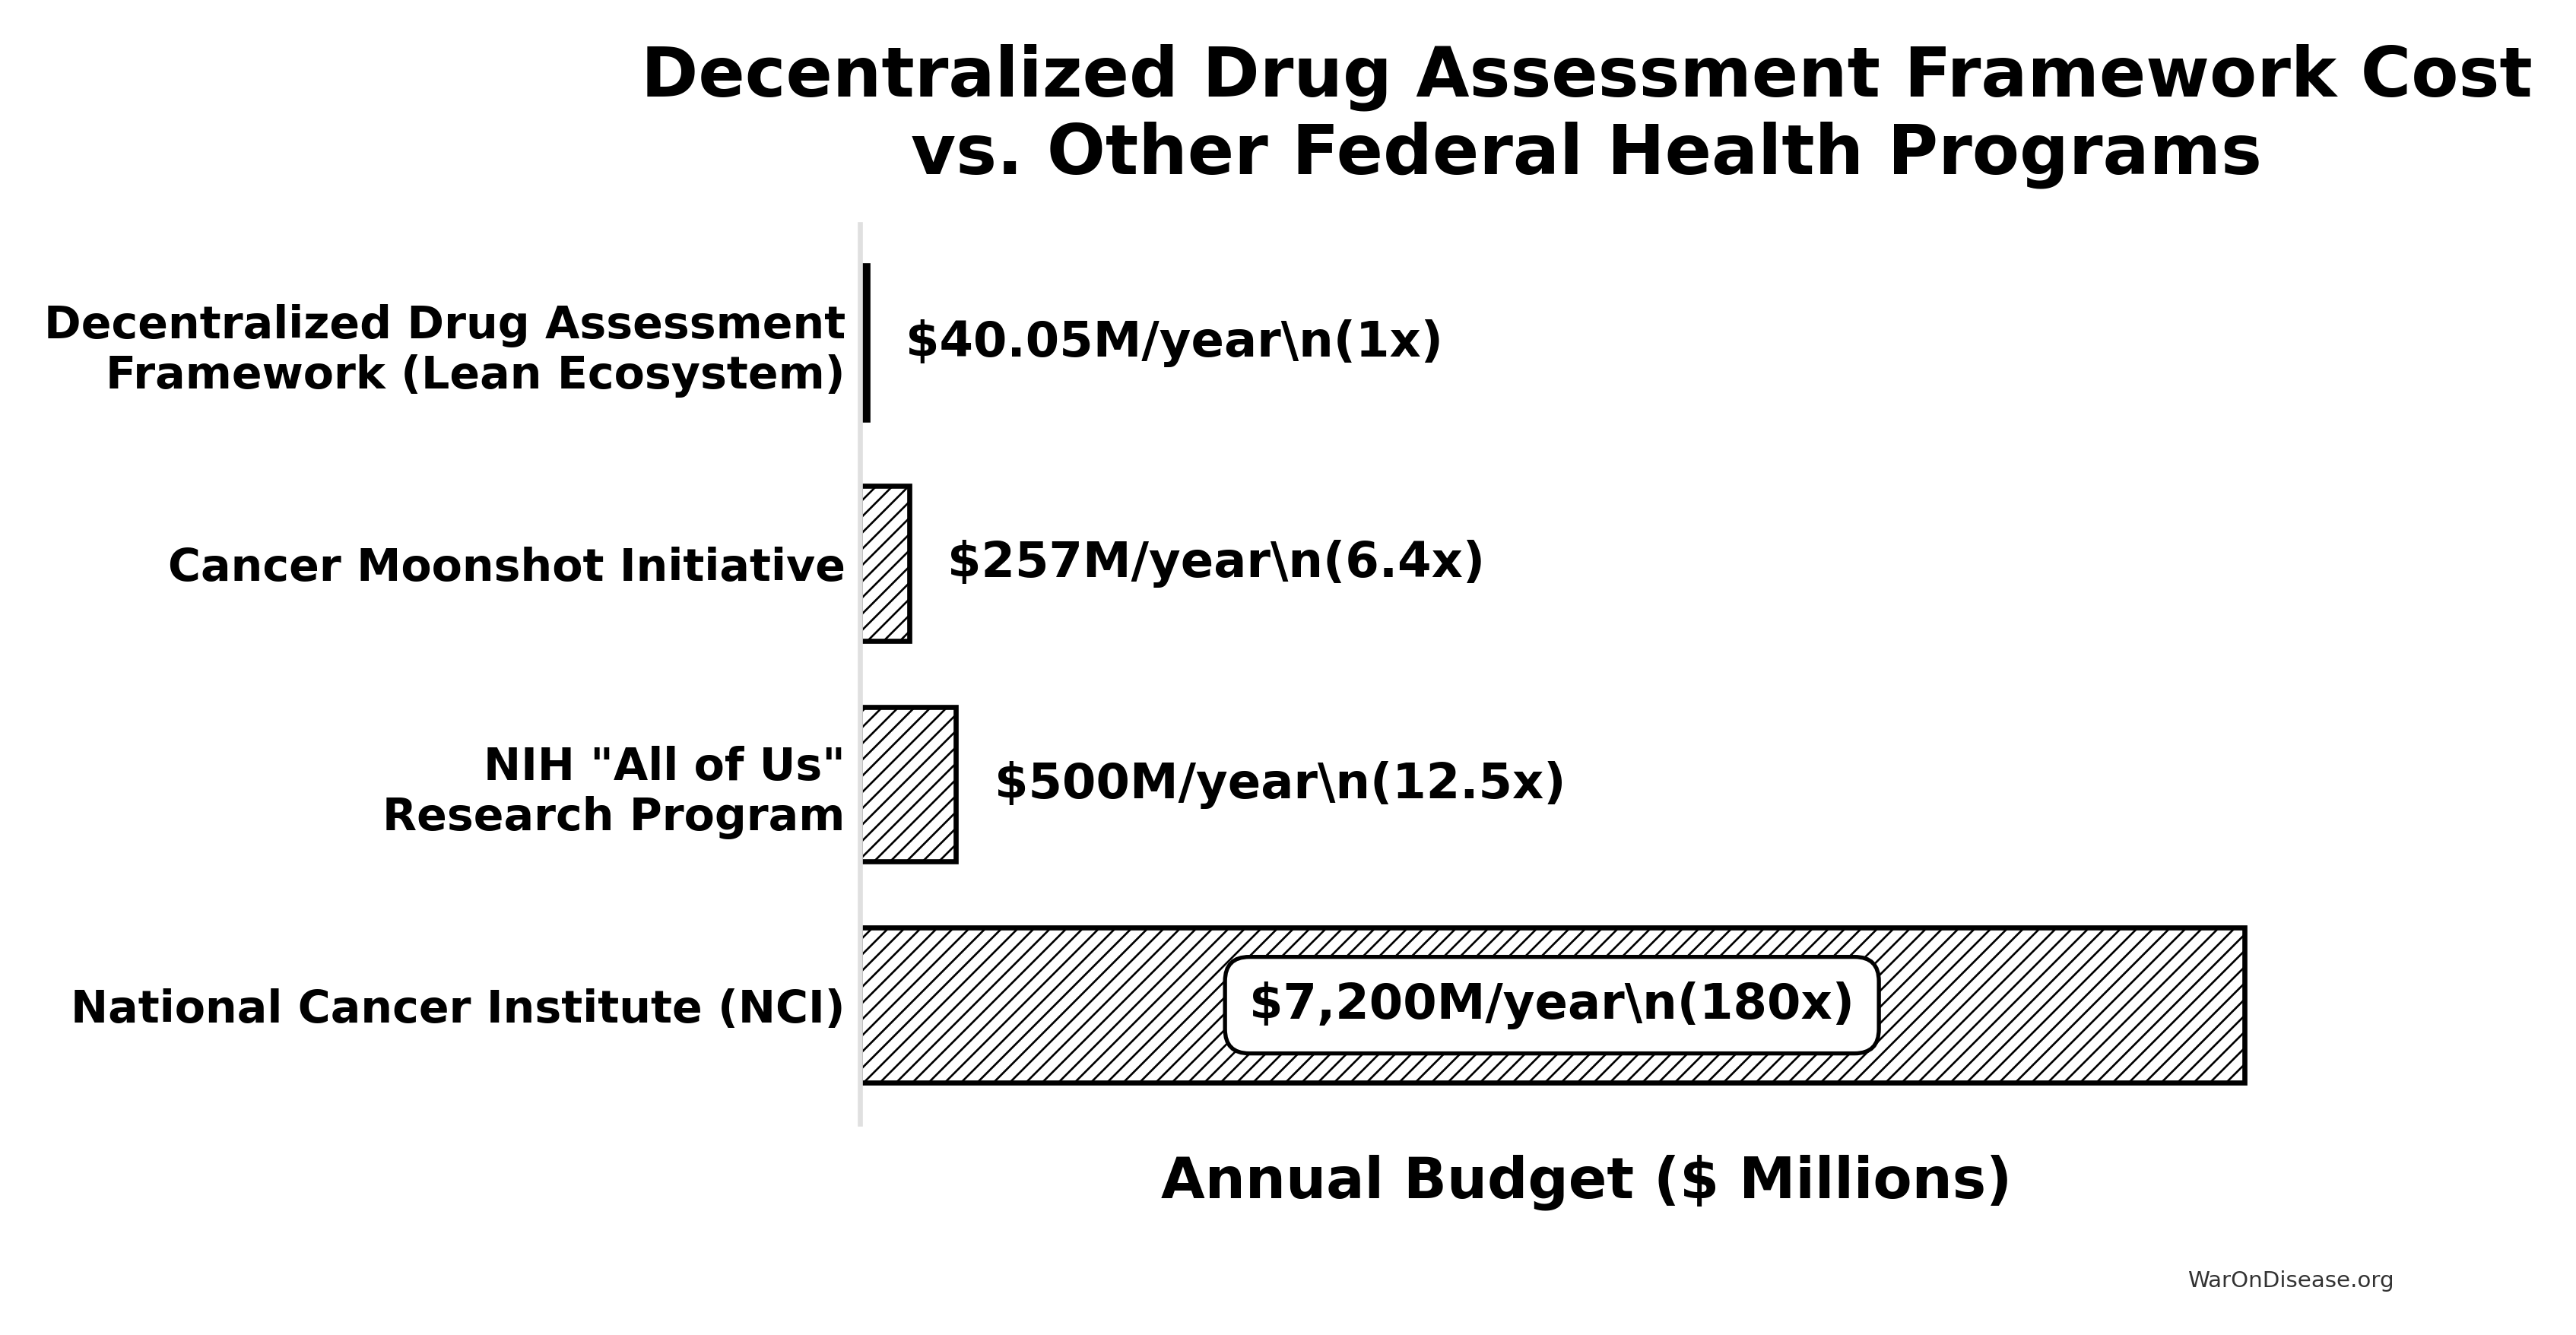
Translation for Budget Committees: The estimated annual cost of this initiative is an order of magnitude smaller than the budgets for other major national health priorities like the “All of Us” program or the Cancer Moonshot. It represents approximately 0.55% of the NCI’s annual budget (calculated from the system’s annual cost and NCI budget155). This comparison underscores that such an infrastructure is not only a high-leverage investment (due to its massive ROI) but also a remarkably cost-effective one relative to the scale of federal health and technology spending.
14 Why This Differs from Failed Megaprojects
Large-scale interventions face legitimate skepticism. The development economics literature documents numerous failures: infrastructure megaprojects that exceed budgets by 50-100%, foreign aid programs with negative or negligible returns, and “grand challenges” that fail to materialize promised benefits.
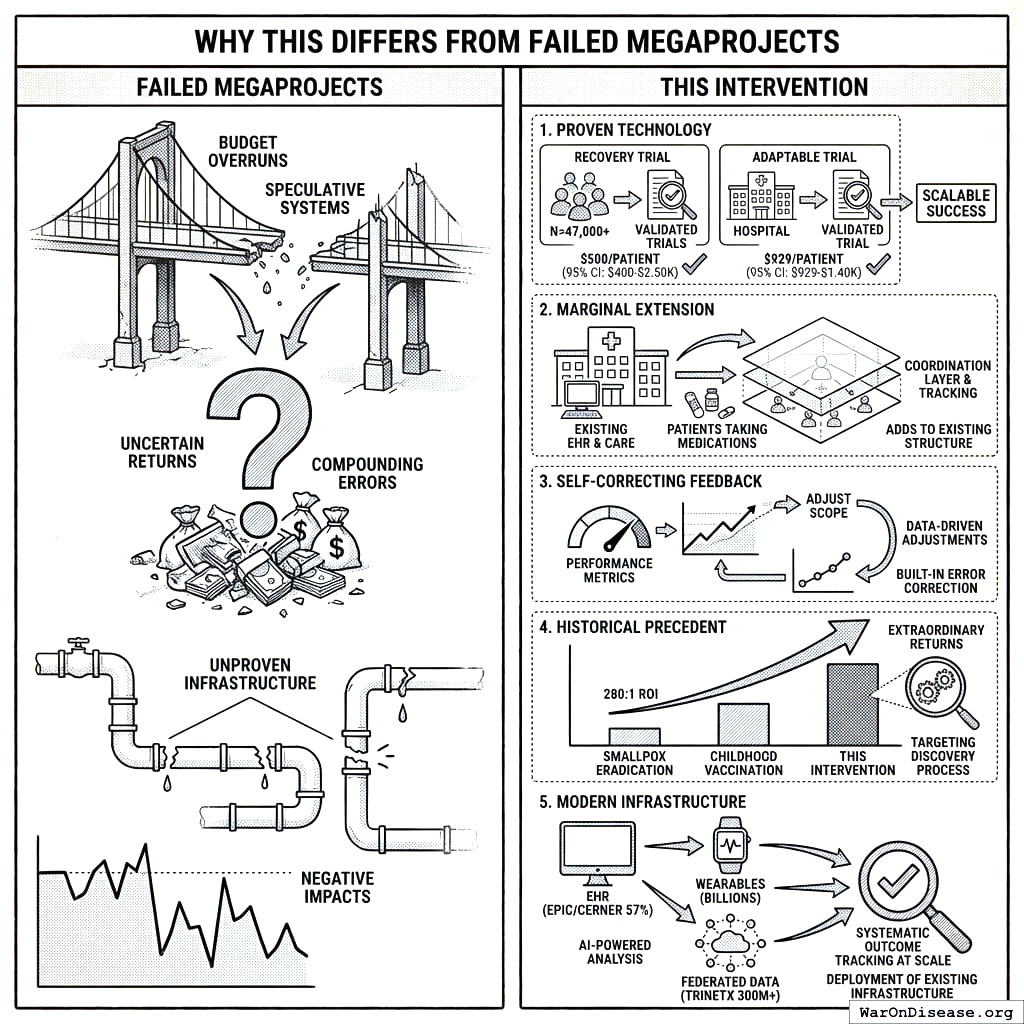
This intervention differs in five critical ways:
Proven Technology: Unlike speculative moonshots, pragmatic trials using existing EHR infrastructure have been validated. The RECOVERY trial enrolled 47,000+ patients at $500 (95% CI: $400-$2.5K)/patient. ADAPTABLE achieved $929 (95% CI: $929-$1.4K)/patient in routine US healthcare settings. This isn’t “we hope this works” - it’s “we’ve proven this works, now scale it.”
Marginal Extension, Not Novel System: The framework extends existing clinical trial infrastructure rather than replacing it. Hospitals already have EHRs. Patients already take medications. We’re adding a coordination layer and outcome tracking, not building from scratch.
Self-Correcting Feedback: Unlike infrastructure projects where failures compound, the protocol has built-in error correction. If a treatment doesn’t work, the data shows it. If costs exceed projections, we can adjust scope. The framework generates its own performance metrics.
Historical Precedent: Smallpox eradication (280:1 ROI) and childhood vaccination programs demonstrate that systematic health interventions can achieve extraordinary returns. The difference: those targeted specific diseases. This targets the discovery process itself, potentially even higher leverage.
Modern Infrastructure Makes This Possible Now: The convergence of electronic health records (major EHR systems covering 57% of US hospitals), consumer wearables (billions of devices tracking health metrics), federated data networks (querying 300M+ patient records without moving data), and AI-powered analysis enables systematic outcome tracking at scale that wasn’t feasible even a decade ago. This isn’t speculation about future technology - it’s deployment of existing, proven infrastructure.
References
1.
NIH Common Fund. NIH pragmatic trials: Minimal funding despite 30x cost advantage. NIH Common Fund: HCS Research Collaboratory https://commonfund.nih.gov/hcscollaboratory (2025)
The NIH Pragmatic Trials Collaboratory funds trials at $500K for planning phase, $1M/year for implementation-a tiny fraction of NIH’s budget. The ADAPTABLE trial cost $14 million for 15,076 patients (= $929/patient) versus $420 million for a similar traditional RCT (30x cheaper), yet pragmatic trials remain severely underfunded. PCORnet infrastructure enables real-world trials embedded in healthcare systems, but receives minimal support compared to basic research funding. Additional sources: https://commonfund.nih.gov/hcscollaboratory | https://pcornet.org/wp-content/uploads/2025/08/ADAPTABLE_Lay_Summary_21JUL2025.pdf | https://www.ncbi.nlm.nih.gov/pmc/articles/PMC5604499/
.2.
NIH. Antidepressant clinical trial exclusion rates. Zimmerman et al. https://pubmed.ncbi.nlm.nih.gov/26276679/ (2015)
Mean exclusion rate: 86.1% across 158 antidepressant efficacy trials (range: 44.4% to 99.8%) More than 82% of real-world depression patients would be ineligible for antidepressant registration trials Exclusion rates increased over time: 91.4% (2010-2014) vs. 83.8% (1995-2009) Most common exclusions: comorbid psychiatric disorders, age restrictions, insufficient depression severity, medical conditions Emergency psychiatry patients: only 3.3% eligible (96.7% excluded) when applying 9 common exclusion criteria Only a minority of depressed patients seen in clinical practice are likely to be eligible for most AETs Note: Generalizability of antidepressant trials has decreased over time, with increasingly stringent exclusion criteria eliminating patients who would actually use the drugs in clinical practice Additional sources: https://pubmed.ncbi.nlm.nih.gov/26276679/ | https://pubmed.ncbi.nlm.nih.gov/26164052/ | https://www.wolterskluwer.com/en/news/antidepressant-trials-exclude-most-real-world-patients-with-depression
.3.
CNBC. Warren buffett’s career average investment return. CNBC https://www.cnbc.com/2025/05/05/warren-buffetts-return-tally-after-60-years-5502284percent.html (2025)
Berkshire’s compounded annual return from 1965 through 2024 was 19.9%, nearly double the 10.4% recorded by the S&P 500. Berkshire shares skyrocketed 5,502,284% compared to the S&P 500’s 39,054% rise during that period. Additional sources: https://www.cnbc.com/2025/05/05/warren-buffetts-return-tally-after-60-years-5502284percent.html | https://www.slickcharts.com/berkshire-hathaway/returns
.4.
World Health Organization. WHO global health estimates 2024. World Health Organization https://www.who.int/data/gho/data/themes/mortality-and-global-health-estimates (2024)
Comprehensive mortality and morbidity data by cause, age, sex, country, and year Global mortality: 55-60 million deaths annually Lives saved by modern medicine (vaccines, cardiovascular drugs, oncology): 12M annually (conservative aggregate) Leading causes of death: Cardiovascular disease (17.9M), Cancer (10.3M), Respiratory disease (4.0M) Note: Baseline data for regulatory mortality analysis. Conservative estimate of pharmaceutical impact based on WHO immunization data (4.5M/year from vaccines) + cardiovascular interventions (3.3M/year) + oncology (1.5M/year) + other therapies. Additional sources: https://www.who.int/data/gho/data/themes/mortality-and-global-health-estimates
.5.
GiveWell. GiveWell cost per life saved for top charities (2024). GiveWell: Top Charities https://www.givewell.org/charities/top-charities
General range: $3,000-$5,500 per life saved (GiveWell top charities) Helen Keller International (Vitamin A): $3,500 average (2022-2024); varies $1,000-$8,500 by country Against Malaria Foundation: $5,500 per life saved New Incentives (vaccination incentives): $4,500 per life saved Malaria Consortium (seasonal malaria chemoprevention): $3,500 per life saved VAS program details: $2 to provide vitamin A supplements to child for one year Note: Figures accurate for 2024. Helen Keller VAS program has wide country variation ($1K-$8.5K) but $3,500 is accurate average. Among most cost-effective interventions globally Additional sources: https://www.givewell.org/charities/top-charities | https://www.givewell.org/charities/helen-keller-international | https://ourworldindata.org/cost-effectiveness
.6.
AARP. Unpaid caregiver hours and economic value. AARP 2023 https://www.aarp.org/caregiving/financial-legal/info-2023/unpaid-caregivers-provide-billions-in-care.html (2023)
Average family caregiver: 25-26 hours per week (100-104 hours per month) 38 million caregivers providing 36 billion hours of care annually Economic value: $16.59 per hour = $600 billion total annual value (2021) 28% of people provided eldercare on a given day, averaging 3.9 hours when providing care Caregivers living with care recipient: 37.4 hours per week Caregivers not living with recipient: 23.7 hours per week Note: Disease-related caregiving is subset of total; includes elderly care, disability care, and child care Additional sources: https://www.aarp.org/caregiving/financial-legal/info-2023/unpaid-caregivers-provide-billions-in-care.html | https://www.bls.gov/news.release/elcare.nr0.htm | https://www.caregiver.org/resource/caregiver-statistics-demographics/
.7.
Forbes. Forbes world’s billionaires list 2024. (2024)
Forbes identified a record 2,781 billionaires worldwide with combined net worth of $14.2 trillion, 141 more than 2023. Bernard Arnault (LVMH) topped the list at $233 billion.
8.
CDC MMWR. Childhood vaccination economic benefits. CDC MMWR https://www.cdc.gov/mmwr/volumes/73/wr/mm7331a2.htm (1994)
US programs (1994-2023): $540B direct savings, $2.7T societal savings ( $18B/year direct, $90B/year societal) Global (2001-2020): $820B value for 10 diseases in 73 countries ( $41B/year) ROI: $11 return per $1 invested Measles vaccination alone saved 93.7M lives (61% of 154M total) over 50 years (1974-2024) Additional sources: https://www.cdc.gov/mmwr/volumes/73/wr/mm7331a2.htm | https://www.thelancet.com/journals/lancet/article/PIIS0140-6736(24)00850-X/fulltext
.9.
CDC. Childhood vaccination (US) ROI. CDC https://www.cdc.gov/mmwr/preview/mmwrhtml/mm6316a4.htm (2017).
10.
U.S. Bureau of Labor Statistics. CPI inflation calculator. (2024)
CPI-U (1980): 82.4 CPI-U (2024): 313.5 Inflation multiplier (1980-2024): 3.80× Cumulative inflation: 280.48% Average annual inflation rate: 3.08% Note: Official U.S. government inflation data using Consumer Price Index for All Urban Consumers (CPI-U). Additional sources: https://www.bls.gov/data/inflation_calculator.htm
.11.
James Surowiecki. The Wisdom of Crowds. (Surowiecki, 2004).
Explores the aggregation of information in groups, arguing that decisions are often better than could have been made by any single member of the group. The opening anecdote relates Francis Galton’s surprise that the crowd at a county fair accurately guessed the weight of an ox when the median of their individual guesses was taken. The three conditions for a group to be intelligent are diversity, independence, and decentralization. Additional sources: https://archive.org/details/wisdomofcrowds0000suro | https://en.wikipedia.org/wiki/The_Wisdom_of_Crowds | https://www.amazon.com/Wisdom-Crowds-James-Surowiecki/dp/0385721706
.12.
ClinicalTrials.gov API v2 direct analysis. ClinicalTrials.gov cumulative enrollment data (2025). Direct analysis via ClinicalTrials.gov API v2 https://clinicaltrials.gov/data-api/api
Analysis of 100,000 active/recruiting/completed trials on ClinicalTrials.gov (as of January 2025) shows cumulative enrollment of 12.2 million participants: Phase 1 (722k), Phase 2 (2.2M), Phase 3 (6.5M), Phase 4 (2.7M). Median participants per trial: Phase 1 (33), Phase 2 (60), Phase 3 (237), Phase 4 (90). Additional sources: https://clinicaltrials.gov/data-api/api
.13.
ACS CAN. Clinical trial patient participation rate. ACS CAN: Barriers to Clinical Trial Enrollment https://www.fightcancer.org/policy-resources/barriers-patient-enrollment-therapeutic-clinical-trials-cancer
Only 3-5% of adult cancer patients in US receive treatment within clinical trials About 5% of American adults have ever participated in any clinical trial Oncology: 2-3% of all oncology patients participate Contrast: 50-60% enrollment for pediatric cancer trials (<15 years old) Note: 20% of cancer trials fail due to insufficient enrollment; 11% of research sites enroll zero patients Additional sources: https://www.fightcancer.org/policy-resources/barriers-patient-enrollment-therapeutic-clinical-trials-cancer | https://hints.cancer.gov/docs/Briefs/HINTS_Brief_48.pdf
.14.
ScienceDaily. Global prevalence of chronic disease. ScienceDaily: GBD 2015 Study https://www.sciencedaily.com/releases/2015/06/150608081753.htm (2015)
2.3 billion individuals had more than five ailments (2013) Chronic conditions caused 74% of all deaths worldwide (2019), up from 67% (2010) Approximately 1 in 3 adults suffer from multiple chronic conditions (MCCs) Risk factor exposures: 2B exposed to biomass fuel, 1B to air pollution, 1B smokers Projected economic cost: $47 trillion by 2030 Note: 2.3B with 5+ ailments is more accurate than "2B with chronic disease." One-third of all adults globally have multiple chronic conditions Additional sources: https://www.sciencedaily.com/releases/2015/06/150608081753.htm | https://pmc.ncbi.nlm.nih.gov/articles/PMC10830426/ | https://pmc.ncbi.nlm.nih.gov/articles/PMC6214883/
.15.
C&EN. Annual number of new drugs approved globally: 50. C&EN https://cen.acs.org/pharmaceuticals/50-new-drugs-received-FDA/103/i2 (2025)
50 new drugs approved annually Additional sources: https://cen.acs.org/pharmaceuticals/50-new-drugs-received-FDA/103/i2 | https://www.fda.gov/drugs/development-approval-process-drugs/novel-drug-approvals-fda
.16.
Williams, R. J., Tse, T., DiPiazza, K. & Zarin, D. A. Terminated trials in the ClinicalTrials.gov results database: Evaluation of availability of primary outcome data and reasons for termination. PLOS One 10, e0127242 (2015)
Approximately 12% of trials with results posted on the ClinicalTrials.gov results database (905/7,646) were terminated. Primary reasons: insufficient accrual (57% of non-data-driven terminations), business/strategic reasons, and efficacy/toxicity findings (21% data-driven terminations).
17.
IQVIA Report. Global trial capacity. IQVIA Report: Clinical Trial Subjects Number Drops Due to Decline in COVID-19 Enrollment https://gmdpacademy.org/news/iqvia-report-clinical-trial-subjects-number-drops-due-to-decline-in-covid-19-enrollment/
1.9M participants annually (2022, post-COVID normalization from 4M peak in 2021) Additional sources: https://gmdpacademy.org/news/iqvia-report-clinical-trial-subjects-number-drops-due-to-decline-in-covid-19-enrollment/
.18.
Research and Markets. Global clinical trials market 2024. Research and Markets https://www.globenewswire.com/news-release/2024/04/19/2866012/0/en/Global-Clinical-Trials-Market-Research-Report-2024-An-83-16-Billion-Market-by-2030-AI-Machine-Learning-and-Blockchain-will-Transform-the-Clinical-Trials-Landscape.html (2024)
Global clinical trials market valued at approximately $83 billion in 2024, with projections to reach $83-132 billion by 2030. Additional sources: https://www.globenewswire.com/news-release/2024/04/19/2866012/0/en/Global-Clinical-Trials-Market-Research-Report-2024-An-83-16-Billion-Market-by-2030-AI-Machine-Learning-and-Blockchain-will-Transform-the-Clinical-Trials-Landscape.html | https://www.precedenceresearch.com/clinical-trials-market
.19.
OpenSecrets. Lobbying spend (defense). OpenSecrets https://www.opensecrets.org/industries/lobbying?ind=D (2024).
20.
GiveWell. Cost per DALY for deworming programs. https://www.givewell.org/international/technical/programs/deworming/cost-effectiveness
Schistosomiasis treatment: $28.19-$70.48 per DALY (using arithmetic means with varying disability weights) Soil-transmitted helminths (STH) treatment: $82.54 per DALY (midpoint estimate) Note: GiveWell explicitly states this 2011 analysis is "out of date" and their current methodology focuses on long-term income effects rather than short-term health DALYs Additional sources: https://www.givewell.org/international/technical/programs/deworming/cost-effectiveness
.21.
Calculated from IHME Global Burden of Disease (2.55B DALYs) and global GDP per capita valuation. $109 trillion annual global disease burden.
The global economic burden of disease, including direct healthcare costs ($8.2 trillion) and lost productivity ($100.9 trillion from 2.55 billion DALYs × $39,570 per DALY), totals approximately $109.1 trillion annually.
22.
U.S. Department of Transportation. Departmental guidance on valuation of a statistical life in economic analysis. (2024).
23.
Think by Numbers. Pre-1962 drug development costs and timeline (think by numbers). Think by Numbers: How Many Lives Does FDA Save? https://thinkbynumbers.org/health/how-many-net-lives-does-the-fda-save/ (1962)
Historical estimates (1970-1985): USD $226M fully capitalized (2011 prices) 1980s drugs: $65M after-tax R&D (1990 dollars), $194M compounded to approval (1990 dollars) Modern comparison: $2-3B costs, 7-12 years (dramatic increase from pre-1962) Context: 1962 regulatory clampdown reduced new treatment production by 70%, dramatically increasing development timelines and costs Note: Secondary source; less reliable than Congressional testimony Additional sources: https://thinkbynumbers.org/health/how-many-net-lives-does-the-fda-save/ | https://en.wikipedia.org/wiki/Cost_of_drug_development | https://www.statnews.com/2018/10/01/changing-1962-law-slash-drug-prices/
.24.
Biotechnology Innovation Organization (BIO). BIO clinical development success rates 2011-2020. Biotechnology Innovation Organization (BIO) https://go.bio.org/rs/490-EHZ-999/images/ClinicalDevelopmentSuccessRates2011_2020.pdf (2021)
Phase I duration: 2.3 years average Total time to market (Phase I-III + approval): 10.5 years average Phase transition success rates: Phase I→II: 63.2%, Phase II→III: 30.7%, Phase III→Approval: 58.1% Overall probability of approval from Phase I: 12% Note: Largest publicly available study of clinical trial success rates. Efficacy lag = 10.5 - 2.3 = 8.2 years post-safety verification. Additional sources: https://go.bio.org/rs/490-EHZ-999/images/ClinicalDevelopmentSuccessRates2011_2020.pdf
.25.
Nature Medicine. Drug repurposing rate ( 30%). Nature Medicine https://www.nature.com/articles/s41591-024-03233-x (2024)
Approximately 30% of drugs gain at least one new indication after initial approval. Additional sources: https://www.nature.com/articles/s41591-024-03233-x
.26.
EPI. Education investment economic multiplier (2.1). EPI: Public Investments Outside Core Infrastructure https://www.epi.org/publication/bp348-public-investments-outside-core-infrastructure/
Early childhood education: Benefits 12X outlays by 2050; $8.70 per dollar over lifetime Educational facilities: $1 spent → $1.50 economic returns Energy efficiency comparison: 2-to-1 benefit-to-cost ratio (McKinsey) Private return to schooling: 9% per additional year (World Bank meta-analysis) Note: 2.1 multiplier aligns with benefit-to-cost ratios for educational infrastructure/energy efficiency. Early childhood education shows much higher returns (12X by 2050) Additional sources: https://www.epi.org/publication/bp348-public-investments-outside-core-infrastructure/ | https://documents1.worldbank.org/curated/en/442521523465644318/pdf/WPS8402.pdf | https://freopp.org/whitepapers/establishing-a-practical-return-on-investment-framework-for-education-and-skills-development-to-expand-economic-opportunity/
.27.
PMC. Healthcare investment economic multiplier (1.8). PMC: California Universal Health Care https://pmc.ncbi.nlm.nih.gov/articles/PMC5954824/ (2022)
Healthcare fiscal multiplier: 4.3 (95% CI: 2.5-6.1) during pre-recession period (1995-2007) Overall government spending multiplier: 1.61 (95% CI: 1.37-1.86) Why healthcare has high multipliers: No effect on trade deficits (spending stays domestic); improves productivity & competitiveness; enhances long-run potential output Gender-sensitive fiscal spending (health & care economy) produces substantial positive growth impacts Note: "1.8" appears to be conservative estimate; research shows healthcare multipliers of 4.3 Additional sources: https://pmc.ncbi.nlm.nih.gov/articles/PMC5954824/ | https://cepr.org/voxeu/columns/government-investment-and-fiscal-stimulus | https://ncbi.nlm.nih.gov/pmc/articles/PMC3849102/ | https://set.odi.org/wp-content/uploads/2022/01/Fiscal-multipliers-review.pdf
.28.
World Bank. Infrastructure investment economic multiplier (1.6). World Bank: Infrastructure Investment as Stimulus https://blogs.worldbank.org/en/ppps/effectiveness-infrastructure-investment-fiscal-stimulus-what-weve-learned (2022)
Infrastructure fiscal multiplier: 1.6 during contractionary phase of economic cycle Average across all economic states: 1.5 (meaning $1 of public investment → $1.50 of economic activity) Time horizon: 0.8 within 1 year, 1.5 within 2-5 years Range of estimates: 1.5-2.0 (following 2008 financial crisis & American Recovery Act) Italian public construction: 1.5-1.9 multiplier US ARRA: 0.4-2.2 range (differential impacts by program type) Economic Policy Institute: Uses 1.6 for infrastructure spending (middle range of estimates) Note: Public investment less likely to crowd out private activity during recessions; particularly effective when monetary policy loose with near-zero rates Additional sources: https://blogs.worldbank.org/en/ppps/effectiveness-infrastructure-investment-fiscal-stimulus-what-weve-learned | https://www.gihub.org/infrastructure-monitor/insights/fiscal-multiplier-effect-of-infrastructure-investment/ | https://cepr.org/voxeu/columns/government-investment-and-fiscal-stimulus | https://www.richmondfed.org/publications/research/economic_brief/2022/eb_22-04
.29.
Mercatus. Military spending economic multiplier (0.6). Mercatus: Defense Spending and Economy https://www.mercatus.org/research/research-papers/defense-spending-and-economy
Ramey (2011): 0.6 short-run multiplier Barro (1981): 0.6 multiplier for WWII spending (war spending crowded out 40¢ private economic activity per federal dollar) Barro & Redlick (2011): 0.4 within current year, 0.6 over two years; increased govt spending reduces private-sector GDP portions General finding: $1 increase in deficit-financed federal military spending = less than $1 increase in GDP Variation by context: Central/Eastern European NATO: 0.6 on impact, 1.5-1.6 in years 2-3, gradual fall to zero Ramey & Zubairy (2018): Cumulative 1% GDP increase in military expenditure raises GDP by 0.7% Additional sources: https://www.mercatus.org/research/research-papers/defense-spending-and-economy | https://cepr.org/voxeu/columns/world-war-ii-america-spending-deficits-multipliers-and-sacrifice | https://www.rand.org/content/dam/rand/pubs/research_reports/RRA700/RRA739-2/RAND_RRA739-2.pdf
.30.
FDA. FDA-approved prescription drug products (20,000+). FDA https://www.fda.gov/media/143704/download
There are over 20,000 prescription drug products approved for marketing. Additional sources: https://www.fda.gov/media/143704/download
.31.
FDA. FDA GRAS list count ( 570-700). FDA https://www.fda.gov/food/generally-recognized-safe-gras/gras-notice-inventory
The FDA GRAS (Generally Recognized as Safe) list contains approximately 570–700 substances. Additional sources: https://www.fda.gov/food/generally-recognized-safe-gras/gras-notice-inventory
.32.
ACLED. Active combat deaths annually. ACLED: Global Conflict Surged 2024 https://acleddata.com/2024/12/12/data-shows-global-conflict-surged-in-2024-the-washington-post/ (2024)
2024: 233,597 deaths (30% increase from 179,099 in 2023) Deadliest conflicts: Ukraine (67,000), Palestine (35,000) Nearly 200,000 acts of violence (25% higher than 2023, double from 5 years ago) One in six people globally live in conflict-affected areas Additional sources: https://acleddata.com/2024/12/12/data-shows-global-conflict-surged-in-2024-the-washington-post/ | https://acleddata.com/media-citation/data-shows-global-conflict-surged-2024-washington-post | https://acleddata.com/conflict-index/index-january-2024/
.33.
UCDP. State violence deaths annually. UCDP: Uppsala Conflict Data Program https://ucdp.uu.se/
Uppsala Conflict Data Program (UCDP): Tracks one-sided violence (organized actors attacking unarmed civilians) UCDP definition: Conflicts causing at least 25 battle-related deaths in calendar year 2023 total organized violence: 154,000 deaths; Non-state conflicts: 20,900 deaths UCDP collects data on state-based conflicts, non-state conflicts, and one-sided violence Specific "2,700 annually" figure for state violence not found in recent UCDP data; actual figures vary annually Additional sources: https://ucdp.uu.se/ | https://en.wikipedia.org/wiki/Uppsala_Conflict_Data_Program | https://ourworldindata.org/grapher/deaths-in-armed-conflicts-by-region
.34.
Our World in Data. Terror attack deaths (8,300 annually). Our World in Data: Terrorism https://ourworldindata.org/terrorism (2024)
2023: 8,352 deaths (22% increase from 2022, highest since 2017) 2023: 3,350 terrorist incidents (22% decrease), but 56% increase in avg deaths per attack Global Terrorism Database (GTD): 200,000+ terrorist attacks recorded (2021 version) Maintained by: National Consortium for Study of Terrorism & Responses to Terrorism (START), U. of Maryland Geographic shift: Epicenter moved from Middle East to Central Sahel (sub-Saharan Africa) - now >50% of all deaths Additional sources: https://ourworldindata.org/terrorism | https://reliefweb.int/report/world/global-terrorism-index-2024 | https://www.start.umd.edu/gtd/ | https://ourworldindata.org/grapher/fatalities-from-terrorism
.35.
Institute for Health Metrics and Evaluation (IHME). IHME global burden of disease 2021 (2.88B DALYs, 1.13B YLD). Institute for Health Metrics and Evaluation (IHME) https://vizhub.healthdata.org/gbd-results/ (2024)
In 2021, global DALYs totaled approximately 2.88 billion, comprising 1.75 billion Years of Life Lost (YLL) and 1.13 billion Years Lived with Disability (YLD). This represents a 13% increase from 2019 (2.55B DALYs), largely attributable to COVID-19 deaths and aging populations. YLD accounts for approximately 39% of total DALYs, reflecting the substantial burden of non-fatal chronic conditions. Additional sources: https://vizhub.healthdata.org/gbd-results/ | https://www.thelancet.com/journals/lancet/article/PIIS0140-6736(24)00757-8/fulltext | https://www.healthdata.org/research-analysis/about-gbd
.36.
Costs of War Project, Brown University Watson Institute. Environmental cost of war ($100B annually). Brown Watson Costs of War: Environmental Cost https://watson.brown.edu/costsofwar/costs/social/environment
War on Terror emissions: 1.2B metric tons GHG (equivalent to 257M cars/year) Military: 5.5% of global GHG emissions (2X aviation + shipping combined) US DoD: World’s single largest institutional oil consumer, 47th largest emitter if nation Cleanup costs: $500B+ for military contaminated sites Gaza war environmental damage: $56.4B; landmine clearance: $34.6B expected Climate finance gap: Rich nations spend 30X more on military than climate finance Note: Military activities cause massive environmental damage through GHG emissions, toxic contamination, and long-term cleanup costs far exceeding current climate finance commitments Additional sources: https://watson.brown.edu/costsofwar/costs/social/environment | https://earth.org/environmental-costs-of-wars/ | https://transformdefence.org/transformdefence/stats/
.37.
ScienceDaily. Medical research lives saved annually (4.2 million). ScienceDaily: Physical Activity Prevents 4M Deaths https://www.sciencedaily.com/releases/2020/06/200617194510.htm (2020)
Physical activity: 3.9M early deaths averted annually worldwide (15% lower premature deaths than without) COVID vaccines (2020-2024): 2.533M deaths averted, 14.8M life-years preserved; first year alone: 14.4M deaths prevented Cardiovascular prevention: 3 interventions could delay 94.3M deaths over 25 years (antihypertensives alone: 39.4M) Pandemic research response: Millions of deaths averted through rapid vaccine/drug development Additional sources: https://www.sciencedaily.com/releases/2020/06/200617194510.htm | https://pmc.ncbi.nlm.nih.gov/articles/PMC9537923/ | https://www.ahajournals.org/doi/10.1161/CIRCULATIONAHA.118.038160 | https://pmc.ncbi.nlm.nih.gov/articles/PMC9464102/
.38.
SIPRI. 36:1 disparity ratio of spending on weapons over cures. SIPRI: Military Spending https://www.sipri.org/commentary/blog/2016/opportunity-cost-world-military-spending (2016)
Global military spending: $2.7 trillion (2024, SIPRI) Global government medical research: $68 billion (2024) Actual ratio: 39.7:1 in favor of weapons over medical research Military R&D alone: $85B (2004 data, 10% of global R&D) Military spending increases crowd out health: 1% ↑ military = 0.62% ↓ health spending Note: Ratio actually worse than 36:1. Each 1% increase in military spending reduces health spending by 0.62%, with effect more intense in poorer countries (0.962% reduction) Additional sources: https://www.sipri.org/commentary/blog/2016/opportunity-cost-world-military-spending | https://pmc.ncbi.nlm.nih.gov/articles/PMC9174441/ | https://www.congress.gov/crs-product/R45403
.39.
Think by Numbers. Lost human capital due to war ($270B annually). Think by Numbers https://thinkbynumbers.org/military/war/the-economic-case-for-peace-a-comprehensive-financial-analysis/ (2021)
Lost human capital from war: $300B annually (economic impact of losing skilled/productive individuals to conflict) Broader conflict/violence cost: $14T/year globally 1.4M violent deaths/year; conflict holds back economic development, causes instability, widens inequality, erodes human capital 2002: 48.4M DALYs lost from 1.6M violence deaths = $151B economic value (2000 USD) Economic toll includes: commodity prices, inflation, supply chain disruption, declining output, lost human capital Additional sources: https://thinkbynumbers.org/military/war/the-economic-case-for-peace-a-comprehensive-financial-analysis/ | https://www.weforum.org/stories/2021/02/war-violence-costs-each-human-5-a-day/ | https://pubmed.ncbi.nlm.nih.gov/19115548/
.40.
PubMed. Psychological impact of war cost ($100B annually). PubMed: Economic Burden of PTSD https://pubmed.ncbi.nlm.nih.gov/35485933/
PTSD economic burden (2018 U.S.): $232.2B total ($189.5B civilian, $42.7B military) Civilian costs driven by: Direct healthcare ($66B), unemployment ($42.7B) Military costs driven by: Disability ($17.8B), direct healthcare ($10.1B) Exceeds costs of other mental health conditions (anxiety, depression) War-exposed populations: 2-3X higher rates of anxiety, depression, PTSD; women and children most vulnerable Note: Actual burden $232B, significantly higher than "$100B" claimed Additional sources: https://pubmed.ncbi.nlm.nih.gov/35485933/ | https://news.va.gov/103611/study-national-economic-burden-of-ptsd-staggering/ | https://pmc.ncbi.nlm.nih.gov/articles/PMC9957523/
.41.
CGDev. UNHCR average refugee support cost. CGDev https://www.cgdev.org/blog/costs-hosting-refugees-oecd-countries-and-why-uk-outlier (2024)
The average cost of supporting a refugee is $1,384 per year. This represents total host country costs (housing, healthcare, education, security). OECD countries average $6,100 per refugee (mean 2022-2023), with developing countries spending $700-1,000. Global weighted average of $1,384 is reasonable given that 75-85% of refugees are in low/middle-income countries. Additional sources: https://www.cgdev.org/blog/costs-hosting-refugees-oecd-countries-and-why-uk-outlier | https://www.unhcr.org/sites/default/files/2024-11/UNHCR-WB-global-cost-of-refugee-inclusion-in-host-country-health-systems.pdf
.42.
World Bank. World bank trade disruption cost from conflict. World Bank https://www.worldbank.org/en/topic/trade/publication/trading-away-from-conflict
Estimated $616B annual cost from conflict-related trade disruption. World Bank research shows civil war costs an average developing country 30 years of GDP growth, with 20 years needed for trade to return to pre-war levels. Trade disputes analysis shows tariff escalation could reduce global exports by up to $674 billion. Additional sources: https://www.worldbank.org/en/topic/trade/publication/trading-away-from-conflict | https://www.nber.org/papers/w11565 | http://blogs.worldbank.org/en/trade/impacts-global-trade-and-income-current-trade-disputes
.43.
VA. Veteran healthcare cost projections. VA https://department.va.gov/wp-content/uploads/2025/06/2026-Budget-in-Brief.pdf (2026)
VA budget: $441.3B requested for FY 2026 (10% increase). Disability compensation: $165.6B in FY 2024 for 6.7M veterans. PACT Act projected to increase spending by $300B between 2022-2031. Costs under Toxic Exposures Fund: $20B (2024), $30.4B (2025), $52.6B (2026). Additional sources: https://department.va.gov/wp-content/uploads/2025/06/2026-Budget-in-Brief.pdf | https://www.cbo.gov/publication/45615 | https://www.legion.org/information-center/news/veterans-healthcare/2025/june/va-budget-tops-400-billion-for-2025-from-higher-spending-on-mandated-benefits-medical-care
.44.
IQVIA Institute for Human Data Science. The global use of medicines 2024: Outlook to 2028. IQVIA Institute Report https://www.iqvia.com/insights/the-iqvia-institute/reports-and-publications/reports/the-global-use-of-medicines-2024-outlook-to-2028 (2024)
Global days of therapy reached 1.8 trillion in 2019 (234 defined daily doses per person). Diabetes, respiratory, CVD, and cancer account for 71 percent of medicine use. Projected to reach 3.8 trillion DDDs by 2028.
45.
Sinn, M. P. Private industry clinical trial spending estimate. (2025)
Estimated private pharmaceutical and biotech clinical trial spending is approximately $75-90 billion annually, representing roughly 90% of global clinical trial spending.
46.
Cybersecurity Ventures. Cybercrime economy projected to reach $10.5 trillion. Cybersecurity Ventures: $10.5T Cybercrime https://cybersecurityventures.com/hackerpocalypse-cybercrime-report-2016/ (2016)
Global cybercrime costs: $3T (2015) → $6T (2021) → $10.5T (2025 projected) 15% annual growth rate If measured as country, would be 3rd largest economy after US and China Greatest transfer of economic wealth in history Note: More profitable than global trade of all major illegal drugs combined. Includes data theft, productivity loss, IP theft, fraud Additional sources: <https://cybersecurityventures.com/hackerpocalypse-cybercrime-report-2016/> | https://www.boisestate.edu/cybersecurity/2022/06/16/cybercrime-to-cost-the-world-10-5-trillion-annually-by-2025/
.47.
Sinn, M. P. The Political Dysfunction Tax. https://manual.warondisease.org/knowledge/appendix/political-dysfunction-tax.html (2025) doi:10.5281/zenodo.18603840
Quantifying the gap between current global governance and theoretical maximum welfare, estimating a 31-53% efficiency score and $97 trillion in annual opportunity costs.
48.
Applied Clinical Trials. Global government spending on interventional clinical trials: $3-6 billion/year. Applied Clinical Trials https://www.appliedclinicaltrialsonline.com/view/sizing-clinical-research-market
Estimated range based on NIH ( $0.8-5.6B), NIHR ($1.6B total budget), and EU funding ( $1.3B/year). Roughly 5-10% of global market. Additional sources: https://www.appliedclinicaltrialsonline.com/view/sizing-clinical-research-market | https://www.thelancet.com/journals/langlo/article/PIIS2214-109X(20)30357-0/fulltext
.49.
UBS. Credit suisse global wealth report 2023. Credit Suisse/UBS https://www.ubs.com/global/en/family-office-uhnw/reports/global-wealth-report-2023.html (2023)
Total global household wealth: USD 454.4 trillion (2022) Wealth declined by USD 11.3 trillion (-2.4%) in 2022, first decline since 2008 Wealth per adult: USD 84,718 Additional sources: https://www.ubs.com/global/en/family-office-uhnw/reports/global-wealth-report-2023.html
.50.
Component country budgets. Global government medical research spending ($67.5B, 2023–2024). See component country budgets: NIH Budget https://www.nih.gov/about-nih/what-we-do/budget.
51.
United Nations Department of Economic and Social Affairs, Population Division. World population prospects 2024: Summary of results. (2024)
The 2024 Revision of the World Population Prospects provides population estimates and projections for 237 countries or areas. Global median age approximately 30.5 years in 2024, reflecting population-weighted average across all regions.
52.
SIPRI. Global military spending ($2.72T, 2024). SIPRI https://www.sipri.org/publications/2025/sipri-fact-sheets/trends-world-military-expenditure-2024 (2025).
53.
Stockholm International Peace Research Institute. Trends in world military expenditure, 2024. (2025).
54.
Estimated from major foundation budgets and activities. Nonprofit clinical trial funding estimate.
Nonprofit foundations spend an estimated $2-5 billion annually on clinical trials globally, representing approximately 2-5% of total clinical trial spending.
55.
Industry reports: IQVIA. Global pharmaceutical r&d spending.
Total global pharmaceutical R&D spending is approximately $300 billion annually. Clinical trials represent 15-20% of this total ($45-60B), with the remainder going to drug discovery, preclinical research, regulatory affairs, and manufacturing development.
56.
UN. Global population reaches 8 billion. UN: World Population 8 Billion Nov 15 2022 https://www.un.org/en/desa/world-population-reach-8-billion-15-november-2022 (2022)
Milestone: November 15, 2022 (UN World Population Prospects 2022) Day of Eight Billion" designated by UN Added 1 billion people in just 11 years (2011-2022) Growth rate: Slowest since 1950; fell under 1% in 2020 Future: 15 years to reach 9B (2037); projected peak 10.4B in 2080s Projections: 8.5B (2030), 9.7B (2050), 10.4B (2080-2100 plateau) Note: Milestone reached Nov 2022. Population growth slowing; will take longer to add next billion (15 years vs 11 years) Additional sources: https://www.un.org/en/desa/world-population-reach-8-billion-15-november-2022 | https://www.un.org/en/dayof8billion | https://en.wikipedia.org/wiki/Day_of_Eight_Billion
.57.
Harvard Kennedy School. 3.5% participation tipping point. Harvard Kennedy School https://www.hks.harvard.edu/centers/carr/publications/35-rule-how-small-minority-can-change-world (2020)
The research found that nonviolent campaigns were twice as likely to succeed as violent ones, and once 3.5% of the population were involved, they were always successful. Chenoweth and Maria Stephan studied the success rates of civil resistance efforts from 1900 to 2006, finding that nonviolent movements attracted, on average, four times as many participants as violent movements and were more likely to succeed. Key finding: Every campaign that mobilized at least 3.5% of the population in sustained protest was successful (in their 1900-2006 dataset) Note: The 3.5% figure is a descriptive statistic from historical analysis, not a guaranteed threshold. One exception (Bahrain 2011-2014 with 6%+ participation) has been identified. The rule applies to regime change, not policy change in democracies. Additional sources: https://www.hks.harvard.edu/centers/carr/publications/35-rule-how-small-minority-can-change-world | https://www.hks.harvard.edu/sites/default/files/2024-05/Erica%20Chenoweth_2020-005.pdf | https://www.bbc.com/future/article/20190513-it-only-takes-35-of-people-to-change-the-world | https://en.wikipedia.org/wiki/3.5%25_rule
.58.
World Bank. Gross savings (% of GDP). (2024).
59.
NHGRI. Human genome project and CRISPR discovery. NHGRI https://www.genome.gov/11006929/2003-release-international-consortium-completes-hgp (2003)
Your DNA is 3 billion base pairs Read the entire code (Human Genome Project, completed 2003) Learned to edit it (CRISPR, discovered 2012) Additional sources: https://www.genome.gov/11006929/2003-release-international-consortium-completes-hgp | https://www.nobelprize.org/prizes/chemistry/2020/press-release/
.60.
PMC. Only 12% of human interactome targeted. PMC https://pmc.ncbi.nlm.nih.gov/articles/PMC10749231/ (2023)
Mapping 350,000+ clinical trials showed that only 12% of the human interactome has ever been targeted by drugs. Additional sources: https://pmc.ncbi.nlm.nih.gov/articles/PMC10749231/
.61.
WHO. ICD-10 code count ( 14,000). WHO https://icd.who.int/browse10/2019/en (2019)
The ICD-10 classification contains approximately 14,000 codes for diseases, signs and symptoms. Additional sources: https://icd.who.int/browse10/2019/en
.62.
Wikipedia. Longevity escape velocity (LEV) - maximum human life extension potential. Wikipedia: Longevity Escape Velocity https://en.wikipedia.org/wiki/Longevity_escape_velocity
Longevity escape velocity: Hypothetical point where medical advances extend life expectancy faster than time passes Term coined by Aubrey de Grey (biogerontologist) in 2004 paper; concept from David Gobel (Methuselah Foundation) Current progress: Science adds 3 months to lifespan per year; LEV requires adding >1 year per year Sinclair (Harvard): "There is no biological upper limit to age" - first person to live to 150 may already be born De Grey: 50% chance of reaching LEV by mid-to-late 2030s; SENS approach = damage repair rather than slowing damage Kurzweil (2024): LEV by 2029-2035, AI will simulate biological processes to accelerate solutions George Church: LEV "in a decade or two" via age-reversal clinical trials Natural lifespan cap: 120-150 years (Jeanne Calment record: 122); engineering approach could bypass via damage repair Key mechanisms: Epigenetic reprogramming, senolytic drugs, stem cell therapy, gene therapy, AI-driven drug discovery Current record: Jeanne Calment (122 years, 164 days) - record unbroken since 1997 Note: LEV is theoretical but increasingly plausible given demonstrated age reversal in mice (109% lifespan extension) and human cells (30-year epigenetic age reversal) Additional sources: https://en.wikipedia.org/wiki/Longevity_escape_velocity | https://pmc.ncbi.nlm.nih.gov/articles/PMC423155/ | https://www.popularmechanics.com/science/a36712084/can-science-cure-death-longevity/ | https://www.diamandis.com/blog/longevity-escape-velocity
.63.
OpenSecrets. Lobbyist statistics for washington d.c. OpenSecrets: Lobbying in US https://en.wikipedia.org/wiki/Lobbying_in_the_United_States
Registered lobbyists: Over 12,000 (some estimates); 12,281 registered (2013) Former government employees as lobbyists: 2,200+ former federal employees (1998-2004), including 273 former White House staffers, 250 former Congress members & agency heads Congressional revolving door: 43% (86 of 198) lawmakers who left 1998-2004 became lobbyists; currently 59% leaving to private sector work for lobbying/consulting firms/trade groups Executive branch: 8% were registered lobbyists at some point before/after government service Additional sources: https://en.wikipedia.org/wiki/Lobbying_in_the_United_States | https://www.opensecrets.org/revolving-door | https://www.citizen.org/article/revolving-congress/ | https://www.propublica.org/article/we-found-a-staggering-281-lobbyists-whove-worked-in-the-trump-administration
.64.
MDPI Vaccines. Measles vaccination ROI. MDPI Vaccines https://www.mdpi.com/2076-393X/12/11/1210 (2024)
Single measles vaccination: 167:1 benefit-cost ratio. MMR (measles-mumps-rubella) vaccination: 14:1 ROI. Historical US elimination efforts (1966-1974): benefit-cost ratio of 10.3:1 with net benefits exceeding USD 1.1 billion (1972 dollars, or USD 8.0 billion in 2023 dollars). 2-dose MMR programs show direct benefit/cost ratio of 14.2 with net savings of $5.3 billion, and 26.0 from societal perspectives with net savings of $11.6 billion. Additional sources: https://www.mdpi.com/2076-393X/12/11/1210 | https://www.tandfonline.com/doi/full/10.1080/14760584.2024.2367451
.65.
Gosse, M. E. Assessing cost-effectiveness in healthcare: History of the $50,000 per QALY threshold. Sustainability Impact Metrics https://ecocostsvalue.com/EVR/img/references%20others/Gosse%202008%20QALY%20threshold%20financial.pdf (2008).
66.
World Health Organization. Mental health global burden. World Health Organization https://www.who.int/news/item/28-09-2001-the-world-health-report-2001-mental-disorders-affect-one-in-four-people (2022)
One in four people in the world will be affected by mental or neurological disorders at some point in their lives, representing [approximately] 30% of the global burden of disease. Additional sources: https://www.who.int/news/item/28-09-2001-the-world-health-report-2001-mental-disorders-affect-one-in-four-people
.67.
Stockholm International Peace Research Institute. Trends in world military expenditure, 2023. (2024).
68.
Calculated from Orphanet Journal of Rare Diseases (2024). Diseases getting first effective treatment each year. Calculated from Orphanet Journal of Rare Diseases (2024) https://ojrd.biomedcentral.com/articles/10.1186/s13023-024-03398-1 (2024)
Under the current system, approximately 10-15 diseases per year receive their FIRST effective treatment. Calculation: 5% of 7,000 rare diseases ( 350) have FDA-approved treatment, accumulated over 40 years of the Orphan Drug Act = 9 rare diseases/year. Adding 5-10 non-rare diseases that get first treatments yields 10-20 total. FDA approves 50 drugs/year, but many are for diseases that already have treatments (me-too drugs, second-line therapies). Only 15 represent truly FIRST treatments for previously untreatable conditions.
69.
NIH. NIH budget (FY 2025). NIH https://www.nih.gov/about-nih/organization/budget (2024)
The budget total of $47.7 billion also includes $1.412 billion derived from PHS Evaluation financing... Additional sources: https://www.nih.gov/about-nih/organization/budget | https://officeofbudget.od.nih.gov/
.70.
Bentley et al. NIH spending on clinical trials: 3.3%. Bentley et al. https://pmc.ncbi.nlm.nih.gov/articles/PMC10349341/ (2023)
NIH spent $8.1 billion on clinical trials for approved drugs (2010-2019), representing 3.3% of relevant NIH spending. Additional sources: https://pmc.ncbi.nlm.nih.gov/articles/PMC10349341/ | https://catalyst.harvard.edu/news/article/nih-spent-8-1b-for-phased-clinical-trials-of-drugs-approved-2010-19-10-of-reported-industry-spending/
.71.
PMC. Standard medical research ROI ($20k-$100k/QALY). PMC: Cost-effectiveness Thresholds Used by Study Authors https://pmc.ncbi.nlm.nih.gov/articles/PMC10114019/ (1990)
Typical cost-effectiveness thresholds for medical interventions in rich countries range from $50,000 to $150,000 per QALY. The Institute for Clinical and Economic Review (ICER) uses a $100,000-$150,000/QALY threshold for value-based pricing. Between 1990-2021, authors increasingly cited $100,000 (47% by 2020-21) or $150,000 (24% by 2020-21) per QALY as benchmarks for cost-effectiveness. Additional sources: https://pmc.ncbi.nlm.nih.gov/articles/PMC10114019/ | https://icer.org/our-approach/methods-process/cost-effectiveness-the-qaly-and-the-evlyg/
.72.
Manhattan Institute. RECOVERY trial 82× cost reduction. Manhattan Institute: Slow Costly Trials https://manhattan.institute/article/slow-costly-clinical-trials-drag-down-biomedical-breakthroughs
RECOVERY trial: $500 per patient ($20M for 48,000 patients = $417/patient) Typical clinical trial: $41,000 median per-patient cost Cost reduction: 80-82× cheaper ($41,000 ÷ $500 ≈ 82×) Efficiency: $50 per patient per answer (10 therapeutics tested, 4 effective) Dexamethasone estimated to save >630,000 lives Additional sources: https://manhattan.institute/article/slow-costly-clinical-trials-drag-down-biomedical-breakthroughs | https://pmc.ncbi.nlm.nih.gov/articles/PMC9293394/
.73.
Trials. Patient willingness to participate in clinical trials. Trials: Patients’ Willingness Survey https://trialsjournal.biomedcentral.com/articles/10.1186/s13063-015-1105-3
Recent surveys: 49-51% willingness (2020-2022) - dramatic drop from 85% (2019) during COVID-19 pandemic Cancer patients when approached: 88% consented to trials (Royal Marsden Hospital) Study type variation: 44.8% willing for drug trial, 76.2% for diagnostic study Top motivation: "Learning more about my health/medical condition" (67.4%) Top barrier: "Worry about experiencing side effects" (52.6%) Additional sources: https://trialsjournal.biomedcentral.com/articles/10.1186/s13063-015-1105-3 | https://www.appliedclinicaltrialsonline.com/view/industry-forced-to-rethink-patient-participation-in-trials | https://pmc.ncbi.nlm.nih.gov/articles/PMC7183682/
.74.
Tufts CSDD. Cost of drug development.
Various estimates suggest $1.0 - $2.5 billion to bring a new drug from discovery through FDA approval, spread across 10 years. Tufts Center for the Study of Drug Development often cited for $1.0 - $2.6 billion/drug. Industry reports (IQVIA, Deloitte) also highlight $2+ billion figures.
75.
Value in Health. Average lifetime revenue per successful drug. Value in Health: Sales Revenues for New Therapeutic Agents https://www.sciencedirect.com/science/article/pii/S1098301524027542
Study of 361 FDA-approved drugs from 1995-2014 (median follow-up 13.2 years): Mean lifetime revenue: $15.2 billion per drug Median lifetime revenue: $6.7 billion per drug Revenue after 5 years: $3.2 billion (mean) Revenue after 10 years: $9.5 billion (mean) Revenue after 15 years: $19.2 billion (mean) Distribution highly skewed: top 25 drugs (7%) accounted for 38% of total revenue ($2.1T of $5.5T) Additional sources: https://www.sciencedirect.com/science/article/pii/S1098301524027542
.76.
Lichtenberg, F. R. How many life-years have new drugs saved? A three-way fixed-effects analysis of 66 diseases in 27 countries, 2000-2013. International Health 11, 403–416 (2019)
Using 3-way fixed-effects methodology (disease-country-year) across 66 diseases in 22 countries, this study estimates that drugs launched after 1981 saved 148.7 million life-years in 2013 alone. The regression coefficients for drug launches 0-11 years prior (beta=-0.031, SE=0.008) and 12+ years prior (beta=-0.057, SE=0.013) on years of life lost are highly significant (p<0.0001). Confidence interval for life-years saved: 79.4M-239.8M (95 percent CI) based on propagated standard errors from Table 2.
77.
Deloitte. Pharmaceutical r&d return on investment (ROI). Deloitte: Measuring Pharmaceutical Innovation 2025 https://www.deloitte.com/ch/en/Industries/life-sciences-health-care/research/measuring-return-from-pharmaceutical-innovation.html (2025)
Deloitte’s annual study of top 20 pharma companies by R&D spend (2010-2024): 2024 ROI: 5.9% (second year of growth after decade of decline) 2023 ROI: 4.3% (estimated from trend) 2022 ROI: 1.2% (historic low since study began, 13-year low) 2021 ROI: 6.8% (record high, inflated by COVID-19 vaccines/treatments) Long-term trend: Declining for over a decade before 2023 recovery Average R&D cost per asset: $2.3B (2022), $2.23B (2024) These returns (1.2-5.9% range) fall far below typical corporate ROI targets (15-20%) Additional sources: https://www.deloitte.com/ch/en/Industries/life-sciences-health-care/research/measuring-return-from-pharmaceutical-innovation.html | https://www.prnewswire.com/news-releases/deloittes-13th-annual-pharmaceutical-innovation-report-pharma-rd-return-on-investment-falls-in-post-pandemic-market-301738807.html | https://hitconsultant.net/2023/02/16/pharma-rd-roi-falls-to-lowest-level-in-13-years/
.78.
Nature Reviews Drug Discovery. Drug trial success rate from phase i to approval. Nature Reviews Drug Discovery: Clinical Success Rates https://www.nature.com/articles/nrd.2016.136 (2016)
Overall Phase I to approval: 10-12.8% (conventional wisdom 10%, studies show 12.8%) Recent decline: Average LOA now 6.7% for Phase I (2014-2023 data) Leading pharma companies: 14.3% average LOA (range 8-23%) Varies by therapeutic area: Oncology 3.4%, CNS/cardiovascular lowest at Phase III Phase-specific success: Phase I 47-54%, Phase II 28-34%, Phase III 55-70% Note: 12% figure accurate for historical average. Recent data shows decline to 6.7%, with Phase II as primary attrition point (28% success) Additional sources: https://www.nature.com/articles/nrd.2016.136 | https://pmc.ncbi.nlm.nih.gov/articles/PMC6409418/ | https://academic.oup.com/biostatistics/article/20/2/273/4817524
.79.
SofproMed. Phase 3 cost per trial range. SofproMed https://www.sofpromed.com/how-much-does-a-clinical-trial-cost
Phase 3 clinical trials cost between $20 million and $282 million per trial, with significant variation by therapeutic area and trial complexity. Additional sources: https://www.sofpromed.com/how-much-does-a-clinical-trial-cost | https://www.cbo.gov/publication/57126
.80.
Ramsberg, J. & Platt, R. Pragmatic trial cost per patient (median $97). Learning Health Systems https://pmc.ncbi.nlm.nih.gov/articles/PMC6508852/ (2018)
Meta-analysis of 108 embedded pragmatic clinical trials (2006-2016). The median cost per patient was $97 (IQR $19–$478), based on 2015 dollars. 25% of trials cost <$19/patient; 10 trials exceeded $1,000/patient. U.S. studies median $187 vs non-U.S. median $27. Additional sources: https://pmc.ncbi.nlm.nih.gov/articles/PMC6508852/
.81.
WHO. Polio vaccination ROI. WHO https://www.who.int/news-room/feature-stories/detail/sustaining-polio-investments-offers-a-high-return (2019)
For every dollar spent, the return on investment is nearly US$ 39." Total investment cost of US$ 7.5 billion generates projected economic and social benefits of US$ 289.2 billion from sustaining polio assets and integrating them into expanded immunization, surveillance and emergency response programmes across 8 priority countries (Afghanistan, Iraq, Libya, Pakistan, Somalia, Sudan, Syria, Yemen). Additional sources: https://www.who.int/news-room/feature-stories/detail/sustaining-polio-investments-offers-a-high-return
.82.
ICRC. International campaign to ban landmines (ICBL) - ottawa treaty (1997). ICRC https://www.icrc.org/en/doc/resources/documents/article/other/57jpjn.htm (1997)
ICBL: Founded 1992 by 6 NGOs (Handicap International, Human Rights Watch, Medico International, Mines Advisory Group, Physicians for Human Rights, Vietnam Veterans of America Foundation) Started with ONE staff member: Jody Williams as founding coordinator Grew to 1,000+ organizations in 60 countries by 1997 Ottawa Process: 14 months (October 1996 - December 1997) Convention signed by 122 states on December 3, 1997; entered into force March 1, 1999 Achievement: Nobel Peace Prize 1997 (shared by ICBL and Jody Williams) Government funding context: Canada established $100M CAD Canadian Landmine Fund over 10 years (1997); International donors provided $169M in 1997 for mine action (up from $100M in 1996) Additional sources: https://www.icrc.org/en/doc/resources/documents/article/other/57jpjn.htm | https://en.wikipedia.org/wiki/International_Campaign_to_Ban_Landmines | https://www.nobelprize.org/prizes/peace/1997/summary/ | https://un.org/press/en/1999/19990520.MINES.BRF.html | https://www.the-monitor.org/en-gb/reports/2003/landmine-monitor-2003/mine-action-funding.aspx
.83.
OpenSecrets. Revolving door: Former members of congress. (2024)
388 former members of Congress are registered as lobbyists. Nearly 5,400 former congressional staffers have left Capitol Hill to become federal lobbyists in the past 10 years. Additional sources: https://www.opensecrets.org/revolving-door
.84.
Kinch, M. S. & Griesenauer, R. H. Lost medicines: A longer view of the pharmaceutical industry with the potential to reinvigorate discovery. Drug Discovery Today 24, 875–880 (2019)
Research identified 1,600+ medicines available in 1962. The 1950s represented industry high-water mark with >30 new products in five of ten years; this rate would not be replicated until late 1990s. More than half (880) of these medicines were lost following implementation of Kefauver-Harris Amendment. The peak of 1962 would not be seen again until early 21st century. By 2016 number of organizations actively involved in R&D at level not seen since 1914.
85.
Baily, M. N. Pre-1962 drug development costs (baily 1972). Baily (1972) https://samizdathealth.org/wp-content/uploads/2020/12/hlthaff.1.2.6.pdf (1972)
Pre-1962: Average cost per new chemical entity (NCE) was $6.5 million (1980 dollars) Inflation-adjusted to 2024 dollars: $6.5M (1980) ≈ $22.5M (2024), using CPI multiplier of 3.46× Real cost increase (inflation-adjusted): $22.5M (pre-1962) → $2,600M (2024) = 116× increase Note: This represents the most comprehensive academic estimate of pre-1962 drug development costs based on empirical industry data Additional sources: https://samizdathealth.org/wp-content/uploads/2020/12/hlthaff.1.2.6.pdf
.86.
Think by Numbers. Pre-1962 physician-led clinical trials. Think by Numbers: How Many Lives Does FDA Save? https://thinkbynumbers.org/health/how-many-net-lives-does-the-fda-save/ (1966)
Pre-1962: Physicians could report real-world evidence directly 1962 Drug Amendments replaced "premarket notification" with "premarket approval", requiring extensive efficacy testing Impact: New regulatory clampdown reduced new treatment production by 70%; lifespan growth declined from 4 years/decade to 2 years/decade Drug Efficacy Study Implementation (DESI): NAS/NRC evaluated 3,400+ drugs approved 1938-1962 for safety only; reviewed >3,000 products, >16,000 therapeutic claims FDA has had authority to accept real-world evidence since 1962, clarified by 21st Century Cures Act (2016) Note: Specific "144,000 physicians" figure not verified in sources Additional sources: https://thinkbynumbers.org/health/how-many-net-lives-does-the-fda-save/ | https://www.fda.gov/drugs/enforcement-activities-fda/drug-efficacy-study-implementation-desi | http://www.nasonline.org/about-nas/history/archives/collections/des-1966-1969-1.html
.87.
GAO. 95% of diseases have 0 FDA-approved treatments. GAO https://www.gao.gov/products/gao-25-106774 (2025)
95% of diseases have no treatment Additional sources: https://www.gao.gov/products/gao-25-106774 | https://globalgenes.org/rare-disease-facts/
.88.
Oren Cass, Manhattan Institute. RECOVERY trial cost per patient. Oren Cass https://manhattan.institute/article/slow-costly-clinical-trials-drag-down-biomedical-breakthroughs (2023)
The RECOVERY trial, for example, cost only about $500 per patient... By contrast, the median per-patient cost of a pivotal trial for a new therapeutic is around $41,000. Additional sources: https://manhattan.institute/article/slow-costly-clinical-trials-drag-down-biomedical-breakthroughs
.89.
NHS England; Águas et al. RECOVERY trial global lives saved ( 1 million). NHS England: 1 Million Lives Saved https://www.england.nhs.uk/2021/03/covid-treatment-developed-in-the-nhs-saves-a-million-lives/ (2021)
Dexamethasone saved 1 million lives worldwide (NHS England estimate, March 2021, 9 months after discovery). UK alone: 22,000 lives saved. Methodology: Águas et al. Nature Communications 2021 estimated 650,000 lives (range: 240,000-1,400,000) for July-December 2020 alone, based on RECOVERY trial mortality reductions (36% for ventilated, 18% for oxygen-only patients) applied to global COVID hospitalizations. June 2020 announcement: Dexamethasone reduced deaths by up to 1/3 (ventilated patients), 1/5 (oxygen patients). Impact immediate: Adopted into standard care globally within hours of announcement. Additional sources: https://www.england.nhs.uk/2021/03/covid-treatment-developed-in-the-nhs-saves-a-million-lives/ | https://www.nature.com/articles/s41467-021-21134-2 | https://pharmaceutical-journal.com/article/news/steroid-has-saved-the-lives-of-one-million-covid-19-patients-worldwide-figures-show | https://www.recoverytrial.net/news/recovery-trial-celebrates-two-year-anniversary-of-life-saving-dexamethasone-result
.90.
National September 11 Memorial & Museum. September 11 attack facts. (2024)
2,977 people were killed in the September 11, 2001 attacks: 2,753 at the World Trade Center, 184 at the Pentagon, and 40 passengers and crew on United Flight 93 in Shanksville, Pennsylvania.
91.
World Bank. World bank singapore economic data. World Bank https://data.worldbank.org/country/singapore (2024)
Singapore GDP per capita (2023): $82,000 - among highest in the world Government spending: 15% of GDP (vs US 38%) Life expectancy: 84.1 years (vs US 77.5 years) Singapore demonstrates that low government spending can coexist with excellent outcomes Additional sources: https://data.worldbank.org/country/singapore
.92.
International Monetary Fund. IMF singapore government spending data. (2024)
Singapore government spending is approximately 15% of GDP This is 23 percentage points lower than the United States (38%) Despite lower spending, Singapore achieves excellent outcomes: - Life expectancy: 84.1 years (vs US 77.5) - Low crime, world-class infrastructure, AAA credit rating Additional sources: https://www.imf.org/en/Countries/SGP
.93.
World Health Organization. WHO life expectancy data by country. (2024)
Life expectancy at birth varies significantly among developed nations: Switzerland: 84.0 years (2023) Singapore: 84.1 years (2023) Japan: 84.3 years (2023) United States: 77.5 years (2023) - 6.5 years below Switzerland, Singapore Global average: 73 years Note: US spends more per capita on healthcare than any other nation, yet achieves lower life expectancy Additional sources: https://www.who.int/data/gho/data/themes/mortality-and-global-health-estimates/ghe-life-expectancy-and-healthy-life-expectancy
.94.
CSIS. Smallpox eradication ROI. CSIS https://www.csis.org/analysis/smallpox-eradication-model-global-cooperation.
95.
PMC. Contribution of smoking reduction to life expectancy gains. PMC: Benefits Smoking Cessation Longevity https://www.ncbi.nlm.nih.gov/pmc/articles/PMC1447499/ (2012)
Population-level: Up to 14% (9% men, 14% women) of total life expectancy gain since 1960 due to tobacco control efforts Individual cessation benefits: Quitting at age 35 adds 6.9-8.5 years (men), 6.1-7.7 years (women) vs continuing smokers By cessation age: Age 25-34 = 10 years gained; age 35-44 = 9 years; age 45-54 = 6 years; age 65 = 2.0 years (men), 3.7 years (women) Cessation before age 40: Reduces death risk by 90% Long-term cessation: 10+ years yields survival comparable to never smokers, averts 10 years of life lost Recent cessation: <3 years averts 5 years of life lost Additional sources: https://www.ncbi.nlm.nih.gov/pmc/articles/PMC1447499/ | https://www.cdc.gov/pcd/issues/2012/11_0295.htm | https://www.ajpmonline.org/article/S0749-3797(24)00217-4/fulltext | https://www.nejm.org/doi/full/10.1056/NEJMsa1211128
.96.
ICER. Value per QALY (standard economic value). ICER https://icer.org/wp-content/uploads/2024/02/Reference-Case-4.3.25.pdf (2024)
Standard economic value per QALY: $100,000–$150,000. This is the US and global standard willingness-to-pay threshold for interventions that add costs. Dominant interventions (those that save money while improving health) are favorable regardless of this threshold. Additional sources: https://icer.org/wp-content/uploads/2024/02/Reference-Case-4.3.25.pdf
.97.
GAO. Annual cost of u.s. Sugar subsidies. GAO: Sugar Program https://www.gao.gov/products/gao-24-106144
Consumer costs: $2.5-3.5 billion per year (GAO estimate) Net economic cost: $1 billion per year 2022: US consumers paid 2X world price for sugar Program costs $3-4 billion/year but no federal budget impact (costs passed directly to consumers via higher prices) Employment impact: 10,000-20,000 manufacturing jobs lost annually in sugar-reliant industries (confectionery, etc.) Multiple studies confirm: Sweetener Users Association ($2.9-3.5B), AEI ($2.4B consumer cost), Beghin & Elobeid ($2.9-3.5B consumer surplus) Additional sources: https://www.gao.gov/products/gao-24-106144 | https://www.heritage.org/agriculture/report/the-us-sugar-program-bad-consumers-bad-agriculture-and-bad-america | https://www.aei.org/articles/the-u-s-spends-4-billion-a-year-subsidizing-stalinist-style-domestic-sugar-production/
.98.
World Bank. Swiss military budget as percentage of GDP. World Bank: Military Expenditure https://data.worldbank.org/indicator/MS.MIL.XPND.GD.ZS?locations=CH
2023: 0.70272% of GDP (World Bank) 2024: CHF 5.95 billion official military spending When including militia system costs: 1% GDP (CHF 8.75B) Comparison: Near bottom in Europe; only Ireland, Malta, Moldova spend less (excluding microstates with no armies) Additional sources: https://data.worldbank.org/indicator/MS.MIL.XPND.GD.ZS?locations=CH | https://www.avenir-suisse.ch/en/blog-defence-spending-switzerland-is-in-better-shape-than-it-seems/ | https://tradingeconomics.com/switzerland/military-expenditure-percent-of-gdp-wb-data.html
.99.
World Bank. Switzerland vs. US GDP per capita comparison. World Bank: Switzerland GDP Per Capita https://data.worldbank.org/indicator/NY.GDP.PCAP.CD?locations=CH
2024 GDP per capita (PPP-adjusted): Switzerland $93,819 vs United States $75,492 Switzerland’s GDP per capita 24% higher than US when adjusted for purchasing power parity Nominal 2024: Switzerland $103,670 vs US $85,810 Additional sources: https://data.worldbank.org/indicator/NY.GDP.PCAP.CD?locations=CH | https://tradingeconomics.com/switzerland/gdp-per-capita-ppp | https://www.theglobaleconomy.com/USA/gdp_per_capita_ppp/
.100.
OECD. OECD government spending as percentage of GDP. (2024)
OECD government spending data shows significant variation among developed nations: United States: 38.0% of GDP (2023) Switzerland: 35.0% of GDP - 3 percentage points lower than US Singapore: 15.0% of GDP - 23 percentage points lower than US (per IMF data) OECD average: approximately 40% of GDP Additional sources: https://data.oecd.org/gga/general-government-spending.htm
.101.
OECD. OECD median household income comparison. (2024)
Median household disposable income varies significantly across OECD nations: United States: $77,500 (2023) Switzerland: $55,000 PPP-adjusted (lower nominal but comparable purchasing power) Singapore: $75,000 PPP-adjusted Additional sources: https://data.oecd.org/hha/household-disposable-income.htm
.102.
Cato Institute. Chance of dying from terrorism statistic. Cato Institute: Terrorism and Immigration Risk Analysis https://www.cato.org/policy-analysis/terrorism-immigration-risk-analysis
Chance of American dying in foreign-born terrorist attack: 1 in 3.6 million per year (1975-2015) Including 9/11 deaths; annual murder rate is 253x higher than terrorism death rate More likely to die from lightning strike than foreign terrorism Note: Comprehensive 41-year study shows terrorism risk is extremely low compared to everyday dangers Additional sources: https://www.cato.org/policy-analysis/terrorism-immigration-risk-analysis | https://www.nbcnews.com/news/us-news/you-re-more-likely-die-choking-be-killed-foreign-terrorists-n715141
.103.
Wikipedia. Thalidomide scandal: Worldwide cases and mortality. Wikipedia https://en.wikipedia.org/wiki/Thalidomide_scandal
The total number of embryos affected by the use of thalidomide during pregnancy is estimated at 10,000, of whom about 40% died around the time of birth. More than 10,000 children in 46 countries were born with deformities such as phocomelia. Additional sources: https://en.wikipedia.org/wiki/Thalidomide_scandal
.104.
PLOS One. Health and quality of life of thalidomide survivors as they age. PLOS One https://journals.plos.org/plosone/article?id=10.1371/journal.pone.0210222 (2019)
Study of thalidomide survivors documenting ongoing disability impacts, quality of life, and long-term health outcomes. Survivors (now in their 60s) continue to experience significant disability from limb deformities, organ damage, and other effects. Additional sources: https://journals.plos.org/plosone/article?id=10.1371/journal.pone.0210222
.105.
US Census Bureau. Historical world population estimates. US Census Bureau https://www.census.gov/data/tables/time-series/demo/international-programs/historical-est-worldpop.html
US Census Bureau historical estimates of world population by country and region (1950-2050). US population in 1960: 180 million of 3 billion worldwide (6%). Additional sources: https://www.census.gov/data/tables/time-series/demo/international-programs/historical-est-worldpop.html
.106.
FDA Study via NCBI. Trial costs, FDA study. FDA Study via NCBI https://www.ncbi.nlm.nih.gov/pmc/articles/PMC6248200/
Overall, the 138 clinical trials had an estimated median (IQR) cost of $19.0 million ($12.2 million-$33.1 million)... The clinical trials cost a median (IQR) of $41,117 ($31,802-$82,362) per patient. Additional sources: https://www.ncbi.nlm.nih.gov/pmc/articles/PMC6248200/
.107.
GBD 2019 Diseases and Injuries Collaborators. Global burden of disease study 2019: Disability weights. The Lancet 396, 1204–1222 (2020)
Disability weights for 235 health states used in Global Burden of Disease calculations. Weights range from 0 (perfect health) to 1 (death equivalent). Chronic conditions like diabetes (0.05-0.35), COPD (0.04-0.41), depression (0.15-0.66), and cardiovascular disease (0.04-0.57) show substantial variation by severity. Treatment typically reduces disability weights by 50-80 percent for manageable chronic conditions.
108.
WHO. Annual global economic burden of alzheimer’s and other dementias. WHO: Dementia Fact Sheet https://www.who.int/news-room/fact-sheets/detail/dementia (2019)
Global cost: $1.3 trillion (2019 WHO-commissioned study) 50% from informal caregivers (family/friends, 5 hrs/day) 74% of costs in high-income countries despite 61% of patients in LMICs $818B (2010) → $1T (2018) → $1.3T (2019) - rapid growth Note: Costs increased 35% from 2010-2015 alone. Informal care represents massive hidden economic burden Additional sources: https://www.who.int/news-room/fact-sheets/detail/dementia | https://alz-journals.onlinelibrary.wiley.com/doi/10.1002/alz.12901
.109.
JAMA Oncology. Annual global economic burden of cancer. JAMA Oncology: Global Cost 2020-2050 https://jamanetwork.com/journals/jamaoncology/fullarticle/2801798 (2020)
2020-2050 projection: $25.2 trillion total ($840B/year average) 2010 annual cost: $1.16 trillion (direct costs only) Recent estimate: $3 trillion/year (all costs included) Top 5 cancers: lung (15.4%), colon/rectum (10.9%), breast (7.7%), liver (6.5%), leukemia (6.3%) Note: China/US account for 45% of global burden; 75% of deaths in LMICs but only 50.0% of economic cost Additional sources: https://jamanetwork.com/journals/jamaoncology/fullarticle/2801798 | https://www.nature.com/articles/d41586-023-00634-9
.110.
CDC. U.s. Chronic disease healthcare spending. CDC https://www.cdc.gov/chronic-disease/data-research/facts-stats/index.html
Chronic diseases account for 90% of U.S. healthcare spending ( $3.7T/year). Additional sources: https://www.cdc.gov/chronic-disease/data-research/facts-stats/index.html
.111.
Diabetes Care. Annual global economic burden of diabetes. Diabetes Care: Global Economic Burden https://diabetesjournals.org/care/article/41/5/963/36522/Global-Economic-Burden-of-Diabetes-in-Adults
2015: $1.3 trillion (1.8% of global GDP) 2030 projections: $2.1T-2.5T depending on scenario IDF health expenditure: $760B (2019) → $845B (2045 projected) 2/3 direct medical costs ($857B), 1/3 indirect costs (lost productivity) Note: Costs growing rapidly; expected to exceed $2T by 2030 Additional sources: https://diabetesjournals.org/care/article/41/5/963/36522/Global-Economic-Burden-of-Diabetes-in-Adults | https://doi.org/10.1016/S2213-8587(17)30097-9
.112.
CBO. The 2024 Long-Term Budget Outlook. https://www.cbo.gov/publication/60039 (2024).
113.
World Bank, Bureau of Economic Analysis. US GDP 2024 ($28.78 trillion). World Bank https://data.worldbank.org/indicator/NY.GDP.MKTP.CD?locations=US (2024)
US GDP reached $28.78 trillion in 2024, representing approximately 26% of global GDP. Additional sources: https://data.worldbank.org/indicator/NY.GDP.MKTP.CD?locations=US | https://www.bea.gov/news/2024/gross-domestic-product-fourth-quarter-and-year-2024-advance-estimate
.114.
Environmental Working Group. US farm subsidy database and analysis. Environmental Working Group https://farm.ewg.org/ (2024)
US agricultural subsidies total approximately $30 billion annually, but create much larger economic distortions. Top 10% of farms receive 78% of subsidies, benefits concentrated in commodity crops (corn, soy, wheat, cotton), environmental damage from monoculture incentivized, and overall deadweight loss estimated at $50-120 billion annually. Additional sources: https://farm.ewg.org/ | https://www.ers.usda.gov/topics/farm-economy/farm-sector-income-finances/government-payments-the-safety-net/
.115.
Drug Policy Alliance. The drug war by the numbers. (2021)
Since 1971, the war on drugs has cost the United States an estimated $1 trillion in enforcement. The federal drug control budget was $41 billion in 2022. Mass incarceration costs the U.S. at least $182 billion every year, with over $450 billion spent to incarcerate individuals on drug charges in federal prisons.
116.
International Monetary Fund. IMF fossil fuel subsidies data: 2023 update. (2023)
Globally, fossil fuel subsidies were $7 trillion in 2022 or 7.1 percent of GDP. The United States subsidies totaled $649 billion. Underpricing for local air pollution costs and climate damages are the largest contributor, accounting for about 30 percent each.
117.
Papanicolas, Irene et al. Health care spending in the united states and other high-income countries. Papanicolas et al. https://jamanetwork.com/journals/jama/article-abstract/2674671 (2018)
The US spent approximately twice as much as other high-income countries on medical care (mean per capita: $9,892 vs $5,289), with similar utilization but much higher prices. Administrative costs accounted for 8% of US spending vs 1-3% in other countries. US spending on pharmaceuticals was $1,443 per capita vs $749 elsewhere. Despite spending more, US health outcomes are not better. Additional sources: https://jamanetwork.com/journals/jama/article-abstract/2674671
.118.
Hsieh, C.-T. & Moretti, E. Housing constraints and spatial misallocation. American Economic Journal: Macroeconomics https://www.aeaweb.org/articles?id=10.1257/mac.20170388 (2019)
We quantify the amount of spatial misallocation of labor across US cities and its aggregate costs. Tight land-use restrictions in high-productivity cities like New York, San Francisco, and Boston lowered aggregate US growth by 36% from 1964 to 2009. Local constraints on housing supply have had enormous effects on the national economy. Additional sources: https://www.aeaweb.org/articles?id=10.1257/mac.20170388
.119.
Yale Budget Lab. The fiscal, economic, and distributional effects of all u.s. tariffs. (2025)
Accounting for all the 2025 US tariffs and retaliation implemented to date, the level of real GDP is persistently -0.6% smaller in the long run, the equivalent of $160 billion 2024$ annually.
120.
Tax Foundation. Tax compliance costs the US economy $546 billion annually. https://taxfoundation.org/data/all/federal/irs-tax-compliance-costs/ (2024)
Americans will spend over 7.9 billion hours complying with IRS tax filing and reporting requirements in 2024. This costs the economy roughly $413 billion in lost productivity. In addition, the IRS estimates that Americans spend roughly $133 billion annually in out-of-pocket costs, bringing the total compliance costs to $546 billion, or nearly 2 percent of GDP.
121.
Cook, C., Cole, G., Asaria, P., Jabbour, R. & Francis, D. P. Annual global economic burden of heart disease. International Journal of Cardiology https://www.internationaljournalofcardiology.com/article/S0167-5273(13)02238-9/abstract (2014)
Heart failure alone: $108 billion/year (2012 global analysis, 197 countries) US CVD: $555B (2016) → projected $1.8T by 2050 LMICs total CVD loss: $3.7T cumulative (2011-2015, 5-year period) CVD is costliest disease category in most developed nations Note: No single $2.1T global figure found; estimates vary widely by scope and year Additional sources: https://www.ahajournals.org/doi/10.1161/CIR.0000000000001258
.122.
Source: US Life Expectancy FDA Budget 1543-2019 CSV. US life expectancy growth 1880-1960: 3.82 years per decade. (2019)
Pre-1962: 3.82 years/decade Post-1962: 1.54 years/decade Reduction: 60% decline in life expectancy growth rate Additional sources: https://ourworldindata.org/life-expectancy | https://www.mortality.org/ | https://www.cdc.gov/nchs/nvss/mortality_tables.htm
.123.
Source: US Life Expectancy FDA Budget 1543-2019 CSV. Post-1962 slowdown in life expectancy gains. (2019)
Pre-1962 (1880-1960): 3.82 years/decade Post-1962 (1962-2019): 1.54 years/decade Reduction: 60% decline Temporal correlation: Slowdown occurred immediately after 1962 Kefauver-Harris Amendment Additional sources: https://ourworldindata.org/life-expectancy | https://www.mortality.org/ | https://www.cdc.gov/nchs/nvss/mortality_tables.htm
.124.
Centers for Disease Control and Prevention. US life expectancy 2023. (2024)
US life expectancy at birth was 77.5 years in 2023 Male life expectancy: 74.8 years Female life expectancy: 80.2 years This is 6-7 years lower than peer developed nations despite higher healthcare spending Additional sources: https://www.cdc.gov/nchs/fastats/life-expectancy.htm
.125.
US Census Bureau. US median household income 2023. (2024)
US median household income was $77,500 in 2023 Real median household income declined 0.8% from 2022 Gini index: 0.467 (income inequality measure) Additional sources: https://www.census.gov/library/publications/2024/demo/p60-282.html
.126.
Manuel, D. U.s. Defense spending history: 100 years of military budgets. DaveManuel.com https://www.davemanuel.com/us-defense-spending-history-military-budget-data.php (2025)
US military spending in constant 2024 dollars: 1939 $29B (pre-WW2 baseline), 1940 $37B, 1944 $1,383B, 1945 $1,420B (peak), 1946 $674B, 1947 $176B, 1948 $117B, 2024 $886B. The post-WW2 demobilization cut spending 88% in two years (1945-1947). Current peacetime spending ($886B) is 30x the pre-WW2 baseline and 62% of peak WW2 spending, in inflation-adjusted dollars.
127.
Statista. US military budget as percentage of GDP. Statista https://www.statista.com/statistics/262742/countries-with-the-highest-military-spending/ (2024)
U.S. military spending amounted to 3.5% of GDP in 2024. In 2024, the U.S. spent nearly $1 trillion on its military budget, equal to 3.4% of GDP. Additional sources: https://www.statista.com/statistics/262742/countries-with-the-highest-military-spending/ | https://www.sipri.org/sites/default/files/2025-04/2504_fs_milex_2024.pdf
.128.
US Census Bureau. Number of registered or eligible voters in the u.s. US Census Bureau https://www.census.gov/newsroom/press-releases/2025/2024-presidential-election-voting-registration-tables.html (2024)
73.6% (or 174 million people) of the citizen voting-age population was registered to vote in 2024 (Census Bureau). More than 211 million citizens were active registered voters (86.6% of citizen voting age population) according to the Election Assistance Commission. Additional sources: https://www.census.gov/newsroom/press-releases/2025/2024-presidential-election-voting-registration-tables.html | https://www.eac.gov/news/2025/06/30/us-election-assistance-commission-releases-2024-election-administration-and-voting
.129.
U.S. Senate. Treaties. U.S. Senate https://www.senate.gov/about/powers-procedures/treaties.htm
The Constitution provides that the president ’shall have Power, by and with the Advice and Consent of the Senate, to make Treaties, provided two-thirds of the Senators present concur’ (Article II, section 2). Treaties are formal agreements with foreign nations that require two-thirds Senate approval. 67 senators (two-thirds of 100) must vote to ratify a treaty for it to take effect. Additional sources: https://www.senate.gov/about/powers-procedures/treaties.htm
.130.
Federal Election Commission. Statistical summary of 24-month campaign activity of the 2023-2024 election cycle. (2023)
Presidential candidates raised $2 billion; House and Senate candidates raised $3.8 billion and spent $3.7 billion; PACs raised $15.7 billion and spent $15.5 billion. Total federal campaign spending approximately $20 billion. Additional sources: https://www.fec.gov/updates/statistical-summary-of-24-month-campaign-activity-of-the-2023-2024-election-cycle/
.131.
OpenSecrets. Federal lobbying hit record $4.4 billion in 2024. (2024)
Total federal lobbying reached record $4.4 billion in 2024. The $150 million increase in lobbying continues an upward trend that began in 2016. Additional sources: https://www.opensecrets.org/news/2025/02/federal-lobbying-set-new-record-in-2024/
.132.
Columbia/NBER. Odds of a single vote being decisive in a u.s. Presidential election. Columbia/NBER: What Is the Probability Your Vote Will Make a Difference? https://sites.stat.columbia.edu/gelman/research/published/probdecisive2.pdf (2012)
National average: 1 in 60 million chance (2008 election analysis by Gelman, Silver, Edlin) Swing states (NM, VA, NH, CO): 1 in 10 million chance Non-competitive states: 34 states >1 in 100 million odds; 20 states >1 in 1 billion Washington DC: 1 in 490 billion odds Methodology: Probability state is necessary for electoral college win × probability state vote is tied Additional sources: https://sites.stat.columbia.edu/gelman/research/published/probdecisive2.pdf | https://onlinelibrary.wiley.com/doi/abs/10.1111/j.1465-7295.2010.00272.x
.133.
Hutchinson and Kirk. Valley of death in drug development. (2011)
The overall failure rate of drugs that passed into Phase 1 trials to final approval is 90%. This lack of translation from promising preclinical findings to success in human trials is known as the "valley of death." Estimated 30-50% of promising compounds never proceed to Phase 2/3 trials primarily due to funding barriers rather than scientific failure. The late-stage attrition rate for oncology drugs is as high as 70% in Phase II and 59% in Phase III trials.
134.
DOT. DOT value of statistical life ($13.6M). DOT: VSL Guidance 2024 https://www.transportation.gov/office-policy/transportation-policy/revised-departmental-guidance-on-valuation-of-a-statistical-life-in-economic-analysis (2024)
Current VSL (2024): $13.7 million (updated from $13.6M) Used in cost-benefit analyses for transportation regulations and infrastructure Methodology updated in 2013 guidance, adjusted annually for inflation and real income VSL represents aggregate willingness to pay for safety improvements that reduce fatalities by one Note: DOT has published VSL guidance periodically since 1993. Current $13.7M reflects 2024 inflation/income adjustments Additional sources: https://www.transportation.gov/office-policy/transportation-policy/revised-departmental-guidance-on-valuation-of-a-statistical-life-in-economic-analysis | https://www.transportation.gov/regulations/economic-values-used-in-analysis
.135.
PLOS ONE. Cost per DALY for vitamin a supplementation. PLOS ONE: Cost-effectiveness of "Golden Mustard" for Treating Vitamin A Deficiency in India (2010) https://journals.plos.org/plosone/article?id=10.1371/journal.pone.0012046 (2010)
India: $23-$50 per DALY averted (least costly intervention, $1,000-$6,100 per death averted) Sub-Saharan Africa (2022): $220-$860 per DALY (Burkina Faso: $220, Kenya: $550, Nigeria: $860) WHO estimates for Africa: $40 per DALY for fortification, $255 for supplementation Uganda fortification: $18-$82 per DALY (oil: $18, sugar: $82) Note: Wide variation reflects differences in baseline VAD prevalence, coverage levels, and whether intervention is supplementation or fortification Additional sources: https://journals.plos.org/plosone/article?id=10.1371/journal.pone.0012046 | https://journals.plos.org/plosone/article?id=10.1371/journal.pone.0266495
.136.
UN News. Clean water & sanitation (LMICs) ROI. UN News https://news.un.org/en/story/2014/11/484032 (2014).
137.
PMC. Cost-effectiveness threshold ($50,000/QALY). PMC https://pmc.ncbi.nlm.nih.gov/articles/PMC5193154/
The $50,000/QALY threshold is widely used in US health economics literature, originating from dialysis cost benchmarks in the 1980s. In US cost-utility analyses, 77.5% of authors use either $50,000 or $100,000 per QALY as reference points. Most successful health programs cost $3,000-10,000 per QALY. WHO-CHOICE uses GDP per capita multiples (1× GDP/capita = "very cost-effective", 3× GDP/capita = "cost-effective"), which for the US ( $70,000 GDP/capita) translates to $70,000-$210,000/QALY thresholds. Additional sources: https://pmc.ncbi.nlm.nih.gov/articles/PMC5193154/ | https://pmc.ncbi.nlm.nih.gov/articles/PMC9278384/
.138.
Integrated Benefits Institute. Chronic illness workforce productivity loss. Integrated Benefits Institute 2024 https://www.ibiweb.org/resources/chronic-conditions-in-the-us-workforce-prevalence-trends-and-productivity-impacts (2024)
78.4% of U.S. employees have at least one chronic condition (7% increase since 2021) 58% of employees report physical chronic health conditions 28% of all employees experience productivity loss due to chronic conditions Average productivity loss: $4,798 per employee per year Employees with 3+ chronic conditions miss 7.8 days annually vs 2.2 days for those without Note: 28% productivity loss translates to roughly 11 hours per week (28% of 40-hour workweek) Additional sources: https://www.ibiweb.org/resources/chronic-conditions-in-the-us-workforce-prevalence-trends-and-productivity-impacts | https://www.onemedical.com/mediacenter/study-finds-more-than-half-of-employees-are-living-with-chronic-conditions-including-1-in-3-gen-z-and-millennial-employees/ | https://debeaumont.org/news/2025/poll-the-toll-of-chronic-health-conditions-on-employees-and-workplaces/
.139.
Sinn, M. P. The Continuous Evidence Generation Protocol: Two-Stage Validation (RWE → Pragmatic Trials). https://manual.warondisease.org/knowledge/appendix/dfda-spec-paper.html (2025) doi:10.5281/zenodo.18203375
We present the Predictor Impact Score (PIS), a novel composite metric operationalizing Bradford Hill causality criteria for automated signal detection from aggregated N-of-1 observational studies. Combined with pragmatic trial confirmation (based on evidence from 108+ embedded trials), this two-stage framework would generate validated outcome labels at 44.1x lower cost than traditional Phase III trials. This enables continuous, population-scale pharmacovigilance and precision dosing recommendations.
140.
Sinn, M. P. Ubiquitous Pragmatic Trial Impact Analysis: How to Prevent a Year of Death and Suffering for 84 Cents. https://manual.warondisease.org/knowledge/appendix/dfda-impact-paper.html (2025) doi:10.5281/zenodo.18243914
Only 15 diseases/year get their first treatment each year. With 6.65 thousand diseases lacking effective treatments, the backlog would take 443 years to clear. Integrating pragmatic trials into standard healthcare increases trial capacity 12.3x, cutting that timeline from 443 years to 36 years. The average untreated disease gets a treatment 212 years earlier, saving 10.7 billion deaths at $0.842 per year of healthy life saved.
141.
Murphy, K. M. & Topel, R. H. The value of health and longevity. Journal of Political Economy 114, 871–904 (2006).
142.
Nordhaus, W. D. The Health of Nations: The Contribution of Improved Health to Living Standards. https://www.nber.org/papers/w8818 (2002) doi:10.3386/w8818.
143.
144.
Rogers et al. Decentralized clinical trials (DCT) cost reduction evidence. Rogers et al. https://discovery.dundee.ac.uk/ws/files/72718478/Brit_J_Clinical_Pharma_2022_Rogers_A_systematic_review_of_methods_used_to_conduct_decentralised_clinical_trials.pdf (2022)
DCTs are developing rapidly. However, there is insufficient evidence to confirm which methods are most effective in trial recruitment, retention, or overall cost." Despite this, DCTs have demonstrated potential for significant cost reductions (20-50.0% or more) through reduced site management, travel, and streamlined data collection. DCTs are considered cost-saving by reducing the number of onsite patient visits and decreasing the costs related to time for study nurses and clinicians. Additional sources: https://discovery.dundee.ac.uk/ws/files/72718478/Brit_J_Clinical_Pharma_2022_Rogers_A_systematic_review_of_methods_used_to_conduct_decentralised_clinical_trials.pdf | https://www.nature.com/articles/s41746-024-01214-5
.145.
ICER. ICER QALY methodology and standards. ICER https://icer.org/our-approach/methods-process/cost-effectiveness-the-qaly-and-the-evlyg/ (2024)
The quality-adjusted life year (QALY) is the academic standard for measuring how well all different kinds of medical treatments lengthen and/or improve patients’ lives, and therefore the metric has served as a fundamental component of cost-effectiveness analyses in the US and around the world for more than 30 years. ICER’s health benefit price benchmark (HBPB) will continue to be reported using the standard range from $100,000 to $150,000 per QALY and per evLYG. Additional sources: https://icer.org/our-approach/methods-process/cost-effectiveness-the-qaly-and-the-evlyg/ | https://icer.org/wp-content/uploads/2024/02/Reference-Case-4.3.25.pdf
.146.
WHO. WHO smallpox eradication commemoration (2010). WHO https://www.who.int/news/item/17-05-2010-statue-commemorates-smallpox-eradication (2010)
On May 17, 2010, WHO unveiled a commemorative statue marking the 30th anniversary of smallpox eradication. The $300 million global campaign (1967-1980) prevented an estimated 5 million deaths annually and demonstrated unprecedented international cooperation in public health. The benefit-cost ratio has exceeded 100:1. Additional sources: https://www.who.int/news/item/17-05-2010-statue-commemorates-smallpox-eradication
.147.
CDC. Childhood vaccinations prevent deaths and hospitalizations. CDC https://www.cdc.gov/mmwr/volumes/73/wr/mm7331a2.htm (2023)
Routine childhood vaccinations among 1994–2023 US birth cohorts will prevent 1.1 million deaths, 32 million hospitalizations, and save $2.9 trillion in societal costs. Among children born during 2018–2023, vaccinations will prevent 508,000 premature deaths and 13.5 million hospitalizations over their lifetimes. Additional sources: https://www.cdc.gov/mmwr/volumes/73/wr/mm7331a2.htm
.148.
WHO. WHO clean water and sanitation DALY costs. WHO https://iris.who.int/bitstream/handle/10665/68568/WHO_SDE_WSH_04.04.pdf (2004)
Household water treatment and safe storage interventions cost approximately $20-$500 per disability-adjusted life year (DALY) averted. Community water supply improvements cost $200-$2,000 per DALY averted. These are highly cost-effective interventions by WHO standards. Additional sources: https://iris.who.int/bitstream/handle/10665/68568/WHO_SDE_WSH_04.04.pdf
.149.
JAMA Network Open. Pharmacist-led hypertension management cost-effectiveness. JAMA Network Open https://jamanetwork.com/journals/jamanetworkopen/fullarticle/2811317 (2023)
Recent US studies show pharmacist-led hypertension management programs have incremental cost-effectiveness ratios (ICERs) under $50,000 per QALY, with most interventions falling in the $20,000-$33,000 per QALY range. These interventions are considered highly cost-effective compared to standard care. Additional sources: https://jamanetwork.com/journals/jamanetworkopen/fullarticle/2811317
.150.
WHO. WHO generic drug substitution policy. WHO https://apps.who.int/gb/ebwha/pdf_files/WHA58/WHA58_33-en.pdf (2015)
Generic medicines are by definition cost-saving when therapeutic equivalence is maintained, with typical savings of 30-80% versus brand-name drugs. WHO promotes generic drug use as a key strategy for improving access to essential medicines and reducing healthcare costs globally. Additional sources: https://apps.who.int/gb/ebwha/pdf_files/WHA58/WHA58_33-en.pdf
.151.
eClinicalMedicine. Statins and polypill cost-effectiveness. eClinicalMedicine https://www.thelancet.com/journals/eclinm/article/PIIS2589-5370(22)00155-2/fulltext)00155-2/fulltext (2022)
Polypill strategy was cost-effective compared to other strategies for most sub-groups, ranging from dominance (cost-saving) to £18,811 per QALY. Standard statin was cost-effective across all categories with incremental cost per QALY from £280 to £8,530. In high-risk populations, polypill and statin interventions are often cost-saving. Additional sources: https://www.thelancet.com/journals/eclinm/article/PIIS2589-5370(22)00155-2/fulltext)00155-2/fulltext
.152.
National Cancer Institute. NCI budget and appropriations. (2025).
153.
U.S. Congress. 21st century cures act (2016). (2016)
Additional sources: https://www.congress.gov/bill/114th-congress/house-bill/34 | https://www.fda.gov/regulatory-information/selected-amendments-fdc-act/21st-century-cures-act
.154.
GAO Reports and Public Reporting. HealthCare.gov initial build costs. GAO Reports and Public Reporting https://www.gao.gov/assets/gao-07-49.pdf
The HealthCare.gov website and federal health insurance exchange infrastructure had initial development and deployment costs estimated at $1.7 to $2.1 billion during the 2010-2014 period, though exact figures remain uncertain due to complexity of federal contracting and multiple agencies involved. Additional sources: https://www.gao.gov/assets/gao-07-49.pdf
.155.
AIP. NIH institute and center budgets, FY2024. AIP: FY2024 NIH Budget https://www.aip.org/fyi/fy2024-national-institutes-of-health (2024)
Total NIH FY2024: $48.6B appropriation National Cancer Institute (NCI): $7.22B (-1.3% from FY2023) National Institute of Allergy & Infectious Diseases (NIAID): $6.56B (flat from FY2023) National Institute on Aging (NIA): $4.5B+ ($90M for Alzheimer’s/dementia research) Additional sources: https://www.aip.org/fyi/fy2024-national-institutes-of-health | https://crsreports.congress.gov/product/pdf/R/R43341 | https://www.cancer.gov/grants-training/nci-bottom-line-blog/2024/nci-fy-2024-appropriation-brings-clarity-and-difficult-choices
.Reuse
Copyright
© 2025 The Institute for Accelerated Medicine